
This time it is different, but not in the way that the cheerleaders intended.
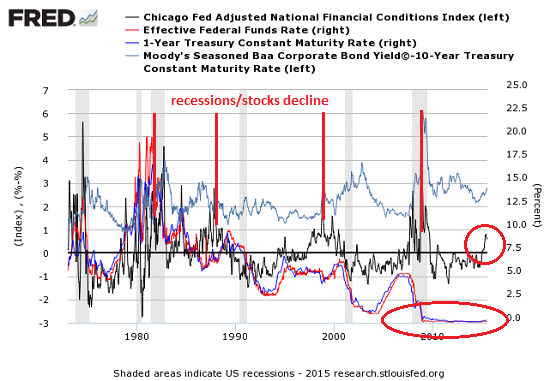
We've seen a lot of extraordinary extremes and divergences in the past fifteen years, but nothing quite like this. Courtesy of longtime correspondent B.C., here is a chart of the Chicago Fed's National Financial Conditions Index, the Fed Funds Rate and the 1-Year Treasury Yield, and a measure of corporate bonds and the 10-year Treasury yield.
When the National Financial Conditions Index rises above the zero line, bad things tend to happen to the stock market and the economy. This index spiked before the recessions in 1977, 1981, 2000 and 2008, and rose before the stock market nosedived in 1987.
This time it is different, but not in the way that the cheerleaders intended.
NOTE: Contributions/subscriptions are acknowledged in the order received. Your name and email remain confidential and will not be given to any other individual, company or agency.
Thank you, Michael J. ($5/month), for your superbly generous subscription to this site-- I am greatly honored by your support and readership.
|