
The superficial conclusion that the reason why housing is unaffordable is a scarcity of housing misses a key dynamic in supply and demand: who has too much money and where do they park it??
The reality is obvious but conventional analysts don't see it, largely because it doesn't fit the approved narratives. Here's why housing is unaffordable to the bottom 90%:
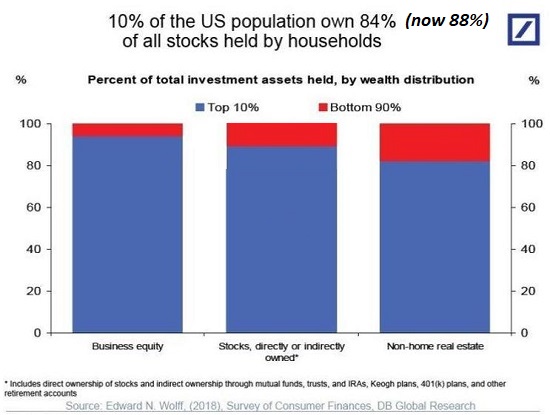
1. The U.S. economy is a bubble economy that funnels the vast majority of gains into the top 10% who own 90% of all income producing assets. Bubbles create astounding sums of unearned wealth and distribute it very asymmetrically: the already-wealthy who inherited assets or acquired them when they were cheap reap most of the gains.
Please examine the first two charts below to see how this works. The first chart shows that the top 10% own between 85% and 95% of all income producing assets: business equity, stocks, bonds and other securities, and non-home real estate, i.e. second homes and income-generating properties.
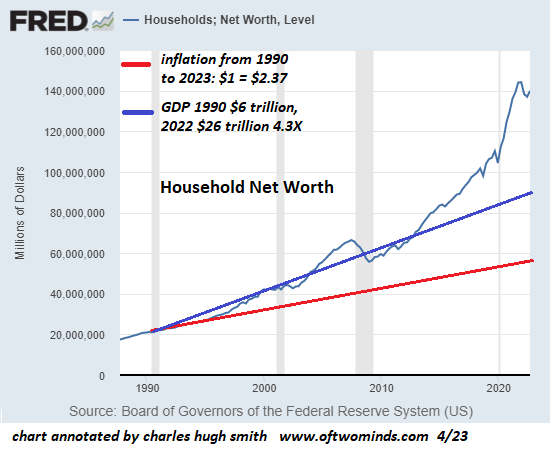
The second chart shows that Household Net Worth--concentrated in the top 10%--soared far above GDP in the Bubble Economy, in effect creating $55 trillion out of thin air and handing 90% of it to the wealthy. Recall that net worth is assets minus liabilities such as debt, so this is what's left after subtracting liabilities/debts. The less wealthy tend to have fewer assets and more debts, so someone may hold title to a $1 million home, but if their mortgage is $900,000, their net worth is only $100,000.
Also note that the family home doesn't generate income, other than for the owner of the mortgage; to the homeowner, it is an expense, not an income source.
Turning to the second chart, we see that if Household Net Worth had tracked the general economy's expansion, i.e. Gross Domestic Product (GDP), it would be less than $90 trillion. Thanks to the Bubble Economy, it's $145.9 trillion, according the Federal Reserve's database. That $55 trillion above the real-world economy's actual expansion is an artifact of the Bubble Economy, an artificial construct of the Federal Reserve's decades of unprecedented manipulation of interest rates and monetary stimulus.
Note that in the previous housing and stock market bubble circa 2006-08, Household Net Worth only exceeded GDP by $5 trillion. A nice chunk of change, to be sure, but an order of magnitude smaller than the gargantuan $55 trillion in "bubble wealth" created in the current central bank Everything Bubble.
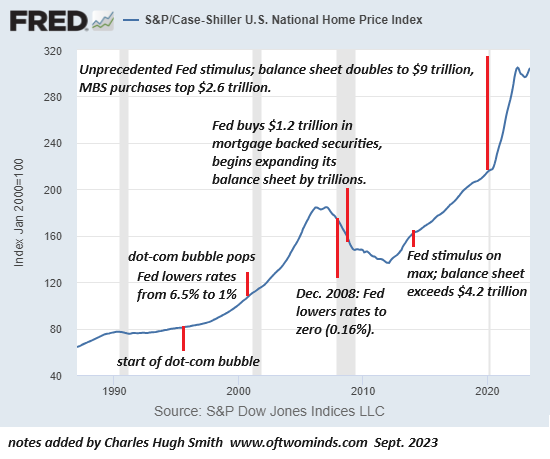
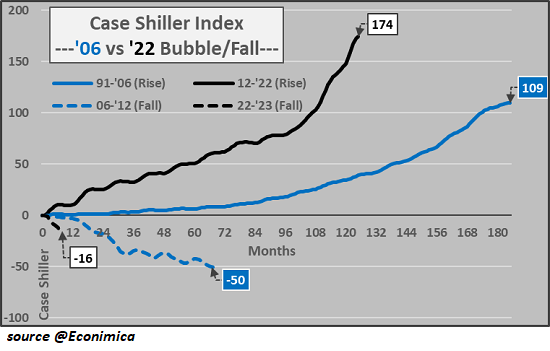
2. As the chart below of housing bubbles #1 and #2 shows, the Fed's unprecedented stimulus inflated Housing Bubbles # and #2. The stock market bubble took off around 1995 (with the introduction of the Netscape browser), and housing's ascent lagged a few years, beginning in the late 1990s. (The chart is the Case-Shiller National Home Price Index.)
But Housing Bubble #1 really only took off after the dot-com stock market bubble popped, and the Fed aggressively lowered interest rates: the Fed Funds Rate fell from 6.5% in summer 2000 to 1% in the summer of 2003.
It remained at a historically low 3% well into 2005, when the housing bubble entered its rocket booster phase of euphoria. The Fed eventually normalized rates, returning to 5% by mid-2007, but as the housing bubble began popping, the Fed quickly started cutting rates again, dropping the Fed Funds Rate to near-zero by December 2008 (0.16%).
3. The wealth created by the Fed's stock and bond bubbles flowed into housing. It is not a coincidence that the Housing Bubble #1 expanded rapidly from 2000 onward. As the stock market bubble deflated, those who had reaped the gains sought a new place to park their excess wealth, and with interest rates falling due to the Fed, housing was the place to put that bubble-generated capital to work: mortgage rates hit historic lows, and the resulting bubble was self-reinforcing: simply securing the purchase rights to an as-yet unbuilt house with a small down payment could generate astounding gains in a few months.
Financial fraud--oops, I mean "innovations"--added icing to the Fed's bubble cake: liar loans, zero down payment mortgages, adjustable rate mortgages, deceptive packaging of toxic mortgages into highly rated mortgage backed securities, etc., fueled the bubble's final blow-off top.
Massive, sustained Fed stimulus inflated Housing Bubble #2, a bubble that went ballistic in 2020 as the Fed engaged in unprecedented stimulus, doubling its balance sheet to $9 trillion, dropping the Fed Funds Rate from a meager 2.4% back to zero, and boosting its portfolio of mortgage-backed securities to $2.6 trillion.
Fed stimulus also inflated bubbles in stocks and bonds: as interest rate fell to near-zero, bonds soared in value, and the S&P 500 index of stocks rocketed from 666 in early 2009 to 3,380 in early 2020--a five-fold increase.
4. The vast majority of these massive gains accrued to the top 10%, roughly 13 million households. (There are 131 million households in the U.S.) The top 10% includes the Financial Nobility (billionaires and those worth hundreds of millions, the top 0.01%); the Financial Aristocracy (households worth tens of millions, the top 0.5%), the wealthy (net worth in the many millions, the top 1%), and the upper middle-class (the bottom 9% of the top 10%).
Historically speaking, the upper-middle class has often owned more than one property: a vacation cabin on the lake or beach, raw land held for investment, or a rental property. With interest rates locked by the Fed at unprecedented lows, the 12 million households in this class who had seen their stock, bond and property portfolios zoom to staggering heights, tapped their new-found wealth and ample credit to go on a housing / real estate buying spree.
Recall that housing was still affordable in the mid to late 1990s. Mechanics and librarians could still buy a modest home in a good neighborhood in the San Francisco Bay Area and many other now-unaffordable metro areas. When the Housing Bubble #1 finally popped, housing was very briefly affordable circa 2012.
5. Many frugal, investment-savvy upper-middle class households acquired properties when they were still affordable. It's not at all uncommon for families to own multiple income properties in addition to the family home. Vacation homes bought decades ago at low prices were converted to short-term vacation rentals for part of the year, generating income when the family wasn't using the home. Nearby cabins were snapped up for investment rentals.
The upper-middle class also inherited properties and other assets. Assets--for example, houses--bought decades ago for $30,000 or $40,000 have soared to $1 million valuations in many metro areas--or even $2 million in desirable neighborhoods. Selling a home for $1+ million leaves more than enough capital to buy multiple properties in less pricey regions.
6. Unfortunately for the upper-middle class, the Financial Aristocracy and the wealthy already own the most desirable properties in the most desirable areas. So the upper-middle class lowered their sights to what was still affordable, and this has driven gentrification: as those with excess capital and credit seek a place to park that wealth that will rise in value, neighborhoods that were once affordable quickly become unaffordable to the bottom 90% as the top 10% bid prices to the moon.
7. The immense wealth created by the Bubble Economy hasn't just enriched a few billionaires; it's created an entire class of wealthy numbering in the millions. When 10 million households have the wealth and credit to buy houses beyond the family home they live in, that's a very large pool of buyers--buyers who have seen their initial purchases soaring in value, incentivizing additional purchases of housing.
8. Housing is priced on the margins, so a relative handful of purchases can push the valuations of an entire neighborhood to the moon. Compared to stocks and bonds, housing is illiquid; transactions are few and take months to settle. The last five sales will adjust the valuation (via appraisals seeking nearby comparables) of the surrounding 100 homes.
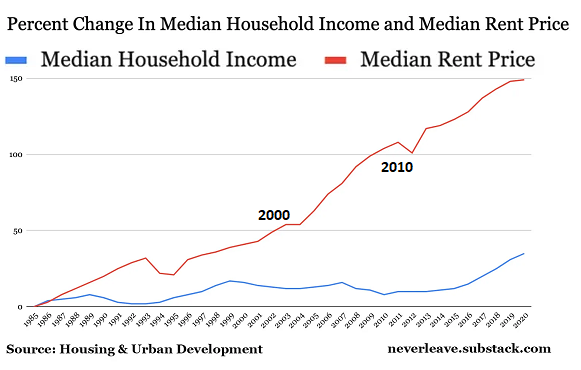
Corporations and the super-wealthy have also been on massive buying sprees, snapping up hundreds or thousands of houses as rental properties. The $55 trillion in excess "bubble wealth" is always seeking a higher return, and as rents have soared (see chart below), rental housing has been seen as a safe and profitable haven for the trillions of dollars floating around seeking a low-risk high return.
As the last chart shows, the current housing bubble is far more extreme than Housing Bubble #1. It took a much shorter period of time to reach far higher heights of overvaluation.
This is why the bottom 90% can't afford a house: the Bubble Economy created $55 trillion out of thin air and 90% of that went to the top 10%, a class historically attuned to owning real estate for income and investment. The bottom 90% skimmed a few bucks in the past 25 years of the Bubble Economy, but nowhere near enough to compete with corporations, the Financial Aristocracy or the upper-middle class.
This is the direct consequence of the Federal Reserve's decades of unprecedented stimulus: extremes of wealth and income inequality that gave the wealthiest households the means to bid up housing to the point it's no longer affordable to the bottom 90%.
 My new book is now available at a 10% discount ($8.95 ebook, $18 print):
Self-Reliance in the 21st Century.
My new book is now available at a 10% discount ($8.95 ebook, $18 print):
Self-Reliance in the 21st Century.
Read the first chapter for free (PDF)
Read excerpts of all three chapters
Podcast with Richard Bonugli: Self Reliance in the 21st Century (43 min)
My recent books:
The Asian Heroine Who Seduced Me
(Novel) print $10.95,
Kindle $6.95
Read an excerpt for free (PDF)
When You Can't Go On: Burnout, Reckoning and Renewal
$18 print, $8.95 Kindle ebook;
audiobook
Read the first section for free (PDF)
Global Crisis, National Renewal: A (Revolutionary) Grand Strategy for the United States
(Kindle $9.95, print $24, audiobook)
Read Chapter One for free (PDF).
A Hacker's Teleology: Sharing the Wealth of Our Shrinking Planet
(Kindle $8.95, print $20,
audiobook $17.46)
Read the first section for free (PDF).
Will You Be Richer or Poorer?: Profit, Power, and AI in a Traumatized World
(Kindle $5, print $10, audiobook)
Read the first section for free (PDF).
The Adventures of the Consulting Philosopher: The Disappearance of Drake (Novel)
$4.95 Kindle, $10.95 print);
read the first chapters
for free (PDF)
Money and Work Unchained $6.95 Kindle, $15 print)
Read the first section for free
Become
a $1/month patron of my work via patreon.com.
Subscribe to my Substack for free
NOTE: Contributions/subscriptions are acknowledged in the order received. Your name and email remain confidential and will not be given to any other individual, company or agency.
|
Thank you, Tom ($50), for your magnificently generous Substack subscription to this site -- I am greatly honored by your support and readership. |
Thank you, mjover ($50), for your superbly generous Substack subscription to this site -- I am greatly honored by your support and readership. |
|
|
Thank you, vailsail ($50), for your splendidly generous Substack subscription to this site -- I am greatly honored by your support and readership. |
Thank you, Gosho ($50), for your marvelously generous Substack subscription to this site -- I am greatly honored by your support and readership. |