





Monday, April 14, 2008

A Desperate Gamble to Keep Up

I like quantification and charts as much as the next person, but some trends cannot be easily charted. I refer to the sense of financial unease which many Americans are experiencing (or perhaps finally admitting to).

I suspect the unease began a generation ago. Operating well below the radar of the myopic media, this undercurrent of insecurity has been feeding the asset bubbles which have undermined the global economy.

Beneath the surface of ordinary awareness, this unease transmogrified into a near-desperation to "keep up" financially by any means possible-- including gambling on dot-com stocks and housing-bubble properties.

We all know wages have been flat for years. The Wage Jump That Never Came (New York Times April 2008)

According to the Center for American Progress:
"Factoring in inflation, hourly wages were only 2.0% higher and weekly wages were only 0.8% higher in January 2008 than in March 2001." But we also know "official inflation" is bogus and that real inflation is roughly double the official rate of approximately 3% per annum. Factoring in a more realistic inflation rate of 6-7%, then clearly the purchasing power of wages has dropped significantly.

Note that a 3% loss of purchasing power (i.e. an inflation rate of 6% instead of 3%) per year amounts to a cumulative decline of 25% over 8 years.

For more on real inflation, please visit Shadow Government Statistics.

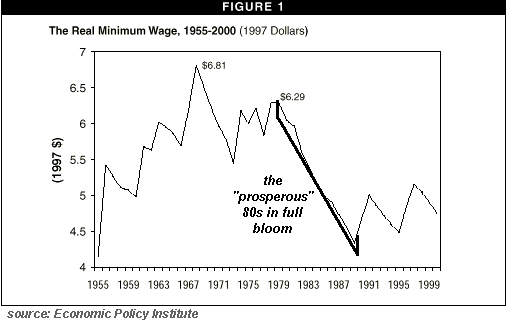
Let's go back 20 years to 1988 and the near-peak of the last, much milder housing bubble. Despite Reagan's brilliant ad campaign proclaiming "It's morning in America" (it shoulda been a movie title), the 1980s were not that kind to the Average American Worker. First, the decade opened with the highest inflation and then the deepest recession since the Great Depression 50 years before. Millions lost their jobs, interest rates skyrocketed above 15% as the Fed tamped down an inflation rate exceeding 10%, and needed fixes to the Social Security system raised taxes on every employee and employer alike.

The typical wage-earner had seen their purchasing power decimated by inflation, and their home values held down by high interest rates. Savers had a field day, locking in interest well above 12%, but potential home buyers were essentially locked out by high rates and points (fees).

As things began looking up, what did the average worker see? Yes, some improvement, but also the Great Con in well-oiled action. As the decade drew to a triumphant close with the tearing down of the Berlin Wall, real estate was again in full boom/bubble mode--but the real money was being made by shysters opening Savings and Loans in low-regulation states like Texas. Offering high interest rates on $100,000 accounts, the S&L crowd loaned huge sums to pals for risky vrentures and used the rest living very high on a fat hog.

When the con fell apart, the taxpayers footed the bill to the tune of about $150 billion: U.S. Savings and Loan Crisis: Case Study.

What was the lesson of the 1980s? Financial fraud was where the big money was made--and when it blew up, the taxpayer bailed out the gamblers. The lesson was not lost on the taxpayers, especially the lower-income ones.

Here is the abstract of an academic study: U.S. Wage Trends in the 1980s: The Role of International Factors by by ROBERT Z. LAWRENCE (Harvard University - John F. Kennedy School of Government; National Bureau of Economic Research)

International trade has had some impact on relative industry wages, but cannot explain widening wage differentials by education, skill, or occupation. Likewise, the slow growth of average wages during the 1980s cannot be explained by international trade.

It's easy to forget that the 1990s did not start that well for average wage earners. A sharp recession in 1990-1991 took the air out of the economy and the housing boom, and the stock market was essentially flat for all of 1994. Though inflation was tamed, interest rates were still about 7-8% and housing was dropping in value. The average employee had about as much financial traction as a 2-ton 1962 Cadillac stuck in 3 feet of gooey mud.

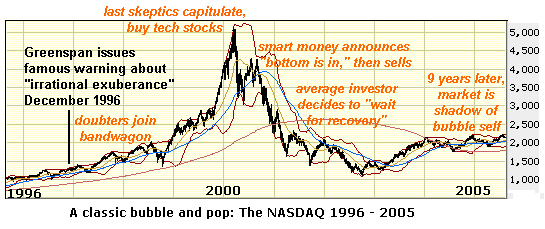
As the 1990 tech/Internet revolution took off, the picture brightened--and it didn't take long for everyone to notice the only real money was being made in stocks, and in particular tech stocks on the Nasdaq. The stock market leaped in 1995, and again in 1996. The Asian Contagion of late 1997 caused a sharp swoon, but soon the markets were back in rally mode. The LTCM and Russian default crisis of 1998 again punctured the swelling balloon, but it quickly reinflated.

By 1999, it was clear there was only two ways to get ahead: either get stock options in a Silicon Valley startup, or buy tech stocks--on margin, if you had any. We can illustrate the psychology at work:

The collapse of the Nasdaq burned millions of small investors who sank IRA and other retirement money (not to mention money borrowed via margin) into tech stocks at the peak or near-peak. Analysts continued calling a "bottom" for years, until the bottom was finally struck with a dull thud in March 2003, after about 80% of the peak valuation had been lost.
(Let me be the first to admit to holding onto some tech stocks past the point of mere pain all the way to mind-numbing losses.)

How many average workers entered the Nasdaq in a big way in 1995 and then exited in late 1999 near the top? Very few. For many, if not most, the decades' "hot investment" was a net loser.

As the Fed dropped interest rates in the early 1990s housing perked up, and a replacement "road to wealth" appeared: good old housing. The same pattern played out again: early "dumb money" (i.e. those who bought homes out of pure luck or because they were moving) reported astonishing profits in just a few years, and soon the "easy road to wealth" bandwagon was rolling.

Once "liar loans," no-down mortgages, adjustable-rate, interest-only and exotic subprime loans were readily available, then the last skeptics surrendered to the apparent "reality" that "housing will never go down" and bought into the burgeoning housing bubble.


Alas, the Nasdaq bust is now playing out, but in slow motion in real estate, for not only is housing far more illiquid than stocks, the financial fallout of the mortgage/housing blow-off is far more widespread.


At every point, the average "investor/"gambler's primary motivation appeared to be simple human greed--the desire to get something for nothing--but perhaps another less visible force was also at work: desperation. Desperation to make up for all the lost purchasing power of the previous decades, for the loss of pensions and job security, for higher taxes, massive student loans (not necessary when college was cheap), and the nagging awareness that simply having a job and working hard were no longer guarantees of anything but a diminishing standard of living.
It's easy to contest this idea, and to lay the blame for the continuous cycle of asset bubbles on the poor fools who bought in and sustained the bubble on the way up. But who made gambling easy? Who refused to lower margin requirements from 50%, which would have cooled off speculation int he dot-com era? The Fed.

Who lowered interest rates to effective zero or less in the early 2000s, goosed the money supply, dropped regulations on banks' activities, and then enabled loose lending standards to run unabated for years? Government agencies, the Fed and ultimately Congress and the White House, who never raised any objections until the horses had left the barn and the gate was discovered to be wide open.

Was the small speculator's behavior irrational (as in "irrational exuberance") or, in light of the declining real wages experienced by most wage earners, was it a rational gamble? I don't know if it was rational, but it was understandable.

Yes, cupidity and greed were undoubtedly part of the frenzy, both in the 1990s dot-com bubble and the 2000s housing bubble. But the lesser-noted reality is the average wage earner has seen their purchasing power decline for years or even decades. Having tried the stock market and been walloped by the dot-bomb collapse, you could almost hear the collective sigh of relief at the realization that the next "sure thing" was something tangible, something everyone could understand: houses.

But alas, a house is a financial asset, and therefore it is susceptible to all the whims and vagaries of the marketplace and arcane government policies which influemce the market. If it is a heavily leveraged asset, then it is a very risk asset to own, and a costly one to dispose of.

Beneath the noisy calls for reform, do we hear a collective sigh of despair? The bet failed, the gamble has been lost, and now that there is no new asset bubble in sight to save us, then perhaps the average worker is finally resigned to the long-resisted fate of living with less, and on less, for a long time to come.

NOTE: contributions are humbly acknowledged in the order received. Your name and email remain confidential and will not be given to any other individual, company or agency.

Thank you, Michael J. M. ($50), for your outrageously generous contribution to this humble site. I am greatly honored by your support and readership. All contributors are listed below in acknowledgement of my gratitude.

Read more...

Thursday, April 10, 2008

Cost of Iraq War: $3 Trillion;
Cost of Solar Plants to Power all 105 million U.S Households: $500 Billion

Let's cut to the chase on the Iraq War and ask a cold, brutal question: Is the war to secure Iraq's oil a good "investment" of American capital and lives?

First let's nail down the war's cost and what's at stake in terms of "return on investment."

Joseph Stiglitz and Linda Bilmes have written a book The Three Trillion Dollar War: The True Cost of the Iraq Conflict ; Vanity Fair published this excerpt: The $3 Trillion War.
The authors have since posited that the $3 Trillion estimate is actually too conservative: $3 Trillion May Be Too Low Our original estimate of the cost of the Iraq war was too conservative: in reality the cost for the US will be much higher.

Let's not be coy about the hoped-for "return" on the $3 Trillion investment of cash and 4,000+ American lives: it's the oil. Free the U.S. from the threat of weapons of mass destruction, foster democracy, blah, blah, blah. The purpose of the war is obvious: secure Iraq's oil for the West, establish American military hegemony over the region, and create a bulwark that limits Iran's reach/influence.

So how much is Iraq's oil worth? According to this report from the Brookings Institute:
In its 2000 World Petroleum Assessment, the Department of the Interior's U.S. Geological Survey (USGS) presented figures based on extensive geologic studies by a team of more than 40 geoscientists claiming that, as of the end of 1995, Iraq had 100 bbl of proven reserves, of which 22 bbl had already been recovered. Hence, according to the USGS, Iraq's current proven reserves amount to only 78 bbl--only two-thirds of the DOE's more commonly accepted 112 bbl estimate. Let's be generous and assume Iraq has 100 bbl (billion barrels) of proven oil reserves. At $100/barrel, that oil in the ground is worth $10 trillion. But we can't assume the U.S. will have sole rights to the 100 billion barrels; if Iraq sells its petroleum like other oil exporters, then it will sell oil to a variety of customers such as Japan, China, Europe, etc.

Since U.S. demand is about 25% of global demand, then it would be reasonable to assume that at most 1/3 of Iraq's oil would flow to the U.S. That's about 33 billion barrels, which at $100/barrel is worth $3.3 Trillion. Gee, that's a lousy return on an investment of $3 Trillion and 4,000 lives/20,000 seriously wounded Americans.

(Not to mention the Iraqi casualties. Yes, the war saved those who would have been killed/tortured by Saddam's dictatorship, and that is not a small number. But the war caused casualties which by any fair estimate equal or exceed the casualties Saddam's government, hobbled as it was by "no fly zones," would have inflicted on the Iraqi populace had it been left in power.)

If there is one absolute in the price of oil, it is that it is volatile. If a global recession cuts demand for oil by 5% or more, then the price could plummet to $50/barrel or less. That would certainly make the $3 Trillion "investment" a lousy one.

If, on the other hand, supplies plummet far below demand due to Peak Oil, then oil could easily climb to $200/barrel or even $300/barrel. At $200/barrel, then 30 billion barrels would be worth $6 Trillion--a reasonable "return" for the "investment" of $3 Trillion, but not a great return, for the U.S. has to pay interest on the $3 Trillion it borrowed to fund the war.
The only way to judge whether a return on investment is adequate is to compare it with alternative investments.

With that in mind, let's ask: how much would it cost, using today's technology, to build enough solar-generated electrical capacity to power all 105 million U.S. households? And I mean everything: heating, cooling, TVs, refrigerator, etc.

For cost estimates, let's turn to two large solar projects currently in the works:

SoCal Edison to build $875 million solar energy installation (AP)
Southern California Edison Co. plans to build the nation's largest solar energy installation — an array of collector cells covering two square miles of rooftops that could power about 162,000 homes, the utility announced Thursday.

Edison said it asked state regulators for approval to begin installing the technology on the rooftops of commercial buildings throughout the region over the next five years.
The project would cost an estimated $875 million. The array of solar cells placed atop commercial building rooftops across Southern California would generate 250 megawatts of electricity.

A one-megawatt power plant running continuously at full capacity can power 778 households a year, according to the U.S. Department of Energy."

According to my calculations, 250 megawatts X 778 households = 196,250 homes served, so the SCE estimate (162,000 homes) seems conservative.

2 big projects will amp up solar power in Southland (L.A. Times)

Gov. Arnold Schwarzenegger and Southern California Edison plan to announce today the country's largest rooftop solar installation project ever proposed by a utility company. And on Wednesday, FPL Energy, the largest operator of solar power in the U.S., said it planned to build and operate a 250-megawatt solar plant in the Mojave Desert.

FPL Energy's proposed 250-megawatt plant, dubbed the Beacon Solar Energy Project, will be situated on about 2,000 acres in eastern Kern County."

Here are the details on the Beacon solar thermal power plant, which is expected to cost $1 Billion: BEACON SOLAR ENERGY PROJECT FACT SHEET

The basic idea of solar thermal power generation is simple: place thousands of mirrors on 2,000 acres of hot, clear-sky desert and focus them on tubes filled with high-heat-conductivity liquid which transfers the accumulated thermal energy to turbines which generate electricity. The electricity is generated during peak-use daytime hours; surplus power is stored onsite in high-tech systems using molten salt or transferred elsewhere in the electrical transmission grid.

The most important thing to know is that this is not "new-fangled technology": nine plants of this design has been operating in the Mojave Desert since the 1980s.

And these aren't the only such mega-solar projects being planned. According to Wikipedia's article on the topic:

Solel has signed a contract with Pacific Gas and Electric (PG&E) to build the world's largest solar plant in the Mojave Desert. When fully operational in 2011, the Mojave Solar Park will deliver 553 megawatts of solar power, the equivalent of powering 400,000 homes, to PG&E’s customers in northern and central California. The plant will cover up to 6,000 acres (24 km²) of land.

Let's put this information together. SCE's photovoltaic-panels-on-roofs project will cost $875 million and will generate 250 megawatts, enough for between 160,000 and 200,000 households.

The Beacon solar-thermal plant will cost $1 Billion and generate 250 megawatts on 2,000 acres of desert. Once completed, the plant will require 68 staffers to operate and maintain it. (see factsheet link above.)

As you know from previous entries this week, there are 105 million households in the U.S. (Source: U.S. Census Bureau). If we take the Dept. of Energy estimate that 1 megawatt suffices for 778 households, then we can estimate that 525 solar plants each generating 250 megawatts would supply all the power needed for all 105 million U.S. households.

For a more conservative analysis, then reckon 250 megawatts will supply 175,000 households. Then we'd need 600 solar plants. With the mildest attempts at conservation (see below), then 250 megawatts should easily power 200,000 households.

(Note: few households practice strict conservation; just turning off all the adapters and electronics which are not in use would cumulatively shave off hundreds of megawatts of demand. About 5 percent of household electricity in the U.S. is lost to energizing computers, television and other appliances that are turned off, as a result of poorly designed standby circuitry.

According to The U.S. Department of Energy, there are 2,776 electrical generation plants in the U.S. That means 140 power plants do nothing but generate the electricity wasted by DVD players, TVs, answering machines, stereo systems, xBoxes and computers plugged into wall sockets while not in use. One solution: put as many of these devices as is practical on power strips which can be turned off with one switch.)

The cost of current-technology solar plants which generate 250 megawatts each cost between $875 million and $1 Billion.

So if the U.S. built 500 solar power plants each generating 250 megawatts, the total cost would be $500 Billion-- 1/6 of the cost of the war. Even if you refuse to make any conservation effort then you need 600 plants, and the cost is $600 Billion. Throw in another $100 Billion for new transmission lines, and you might spend $700 Billion-- a third of the cost of the war.

The U.S. spends $250 Billion a year on imported oil. The U.S. consumes about 21 million barrels a day and pumps less than 5 million barrels a day domestically.

Note that the 500 solar plants would generate at least 35,000 new jobs (perhaps laid-off oil-industry workers could be retrained?), and that the total land area required would be a trivial (compared to the deserts in Nevada alone) 2,000 acres X 500 = 1,000,000 acres or 1,563 square miles. The Mojave Desert alone is 50,400 square miles; the deserts in Nevada are even larger. Other suitable solar sites include New Mexico, Colorado, Texas, Utah and Arizona.

Fun Fact: The Nevada Test Site (used for nuclear tests) is 1,350 square miles, roughly equivalent to the area needed to power 105 million U.S. households.

Conclusion: as an investment in energy security, the war in Iraq is a poor investment compared to the construction of 500 solar power plants for approximately $500 - 600 Billion. While we have to pay hundreds of billions a year for the privilege of consuming imported oil, the solar plants require only modest maintenance and operating expenses for decades to come.

Yes, I know we still need oil for transportation and industry: but what if urban transportation (buses and compact autos) were converted to electrical or plug-in-hybrid power trains? How many of those 16 million barrels of imported oil could be spurned? We all know the answer: millions of barrels a day.

What would it take to reduce oil imports to zero, and for the U.S. to live off the 5 million barrels a day which it pumps domestically? It certainly looks like $3 Trillion would go a long way toward making that a reality--and that's with existing, off-the-shelf solar technology and a national electrical grid which is already in use.

Here is an excellent overview of solar thermal power generation:

Solar without the Panels Utilities are using the sun's heat to boil water for steam turbines. (Technology Review, published by M.I.T.)

The appeal of solar thermal power is twofold. It is relatively low cost at a large scale: an economic analysis released last month by Severin Borenstein, director of the University of California's Energy Institute, notes that solar thermal power will become cost competitive with other forms of power generation decades before photovoltaics will, even if greenhouse-gas emissions are not taxed aggressively.

Solar thermal developers also say that their power is more valuable than that provided by wind, currently the fastest-growing form of renewable energy. According to the U.S. Department of Energy, wind power costs about 8 cents per kilowatt, while solar thermal power costs 13 to 17 cents. But power from wind farms fluctuates with every gust and lull; solar thermal plants, on the other hand, capture solar energy as heat, which is much easier to store than electricity. Utilities can dispatch this stored solar energy when they need it--whether or not the sun happens to be shining. "That's going to be worth a lot of money," says Terry Murphy, president and chief executive officer of SolarReserve, a Santa Monica, CA, developer of solar thermal technology. "People are coming to realize that power shifting and 'dispatchability' are key to the utility's requirements to try to balance their system."

Here is a paper which concludes solar-thermal is a better investment than PV (photovoltaic) panels:

The Market Value and Cost of Solar Photovoltaic Electricity Production (37 pages; by Severin Borenstein, director of the University of California's Energy Institute)

The market benefits of installing the current solar PV technology, even after adjusting for its timing and transmission advantages, are calculated to be much smaller than the costs. The difference is so large that including current plausible estimates of the value of reducing greenhouse gases still does not come close to making the net social return on installing solar PV today positive."

Here is an excellent summary of standard costs, solar versus coal/oil-gas-fired plants. Please note that these cost estimates fail to consider the rising cost of coal, natural gas and oil; once the solar plant is built, operating costs are low and stable. Will 10 cents a kilowatt be achievable by conventional power plants if coal, natural gas and oil all double in cost? Obviously not.

Shrinking the cost for solar power (CNET)

Conventionally generated electricity ranges between 5 and 18 cents per kilowatt hour (the amount of money to get a kilowatt of power for an hour) but in most places it's below 10 cents, according to the Energy Information Agency. Solar thermal costs around 15 to 17 cents a kilowatt hour, according to statistics from Schott, a German company that makes solar thermal equipment.

A solar thermal plant would need a facility to store the heat harvested in the day by its sunlight-concentrating mirrors so that the heat could be used to generate electricity at night. "You need the kind of system that can run in the evening," Morse said. At some sites, such as Nevada Solar One, excess heat is stored in molten salt and released at night to run the turbine.

The plant, ideally, should be capable of generating about 300 megawatts of electricity. Those plants can churn out electricity at about 13 cents a kilowatt.

That's still a relatively high price, so utilities would need to group two, three or more 300-megawatt plants together to share operational resources, Morse said. "They could share control rooms or spare parts," he said. That would knock the price closer to 11 cents a kilowatt hour.
"Under 10 cents is sort of the magic line," he said.

Dolezalek puts it another way: the plants need to be around 500 megawatts in size. Most solar thermal plants right now aren't that big. The 22-year-old thermal plant in California's Mojave Desert is 354 megawatts. Utility company Southern California Edison is erecting a 500-megawatt plant scheduled to open in 2009.

By 2014, solar thermal plants located in the Southwest could crank out nearly 3 gigawatts of power, estimated Travis Bradford of the Prometheus Institute for Sustainable Development, a nonprofit based in Cambridge, Mass. That's enough for about 1 million homes.

NOTE: contributions are humbly acknowledged in the order received. Your name and email remain confidential and will not be given to any other individual, company or agency.

Thank you, Benjamin M. ($50), for your second extremely generous contribution to this humble site. I am greatly honored by your support and readership. All contributors are listed below in acknowledgement of my gratitude.
Read more...

Wednesday, April 09, 2008

Real Estate: A Capital Trap for National Savings

The first of this month's highlighted books, Planet of Slums is a brilliant exploration of how mega-cities have become mega-slums.

The core lessons of this important book are profound. Though author Mike Davis focuses on the teeming supercities of the Third World, the same principles apply to First World metropolises and economies as well.

Why is most of the growth in mega-cities concentrated in mega-slums? The summary answer of such complex movements of people and capital runs more or less like this: as nation-states impoverish their rural areas (no investment in rural infrastructure, land piracy by the Party or ruling kelptocracy, price controls to keep incomes low, etc. etc.) the impoverished have little choice but to move to the city and look for marginalized employment there.

Once there, they find the demand for housing of even the most rudimentary sort has driven prices sky-high. The nation-states/elites invest almost zero money in housing for the working poor, and what does get built ends up in the hands of the civil service/ bureaucracy employees.
Contrary to what us naive folks might assume, the really stupendous profits aren't made in luxury buildings--they're generated by tightly packed slums. Here's how it works. Let's say a middle-class flat of 600 square feet (7.5 square meters) goes for $1 per square foot. The slum's equivalent 600 sq. ft. has been cut up into numerous cubbyhole rooms, each housing many people who each pay a relatively high fee for the miserable lodging. The rent per square foot in the slum is thus $5/sq. ft.

According to Davis (and this book is heavily, even obsessively footnoted/sourced), densities in Third World slums are astronomical--18,000 residents per acre is not uncommon. That's four modest-sized 10,000 sq. ft. residential lots in the U.S. suburbs--4 houses that might house 8 people, total, not 18,000.

So slums are immensely profitable--much more profitable than permanent "middle-class" housing. And will you be surprised to learn that most of the property in these mega-city slums is concentrated in a few hands?

The net result of this great urban overcrowding/high-rents/profitability is indeed pernicious. Land values skyrocket as investors domestic and foreign rush in, and the lower ranks of workers who have somehow saved enough to own a piece of property then become petty landlords, exploiting the ranks of those unable to save.

The poorest residents are then forced out of the slums, which are now too expensive, and they become illegal squatters on the city's fringes: often these marginal lands are swamps, filth-laden river banks prone to flooding, or unstable hillsides. Once there is some value in this marginal land--roads and a water pipe--what started out as public land is appropriated by local elites and sold to private developers, who then raze the shacks and build more substantial slum dwellings which rent for a substantial percentage of poor workers' incomes.

The poor are then faced with Hobson's Choice: either pay 50% of their income for a corner of a slum near public transportation, jobs and water, or migrate to the city's distant edge for "free" squatting. The squatting isn't actually free; a numbing three-hour commute is the price of living far from the meager employment (jitneys, vendors, laborers, etc.) in the central city.

Consider the penicious incentives: the local elites are not about to cut their own income by supporting the investment of public or NGO (non-governmental organization) foundation funds for housing the poor or infrastructure in the (non-rent paying) squatter slums. And the rate of return on the overcrowded slums far exceeds the returns made by investing in actual production such as factories, schooling, etc.

So urban land values continue ever higher, pulling much of the nation's capital into urban housing where it becomes a capital trap of national savings. Now "pure capitalism" poses no theoretical objection to this cycle: demand for housing exceeds supply, and if the supply is artificially limited by the elites who own much of the urban property, then the poor go out and appropriate unused public land for squatter slums.

The net result: no capital is invested into production; every cent of investment capital, even that scraped up by the poorest entrepreneur, is pumped into immensely profitable urban slums.
Let's now turn to the U.S., which has seen a similar ballooning of urban and core-suburban value. Despite the obvious need for alternative sources of energy and technology which reduces petroleum consumption, how much global and American capital flowed into these investments for the future (recall the slogan, "energy independence is national security") in the U.S., compared to the trillions pumped into mostly urban real estate?

I haven't been able to find adequate statistics on these investment flows, but it seems the "investment" in urban-suburban real estate is on the order of 100 times the total capital invested in alternative energy research and development.

How many jobs flow from those thousands of granite countertops and fake "Gone with the Wind" staircases in thousands of McMansions and urban condos, and from the hundreds of strip malls constructed in the past decade? None.

Yes, someone was paid to manufacture and install the construction materials, but now that the building is done, there is nothing to show for those trillions of dollars of investment. Just like the Third World mega-slums, America's cities and suburbs are now "capital traps" of national savings.

For it isn't just the capital trapped in empty condo towers and millions (yes, millions, see yesterday's entry sources) of empty houses and the rapidly enptying office parks and malls--it's also all the capital trapped in the financial institutions which enabled the real estate bubble to expand so voraciously and profitably that all other investments paled.

It's no secret that financial firms' profits have grown to the point that they dominate the S&P 500. Trillions of capital are tied up in U.S. real estate and the mortgage-backed securities and other asset-based financial instruments based on residential and commercial real estate.

What could the nation have gained had those trillions been invested in new production of goods and services? Was the entire real estate bubble a vast, perniciously destructive misallocation of national savings into "capital traps"? I think the answer is clearly "yes." Now that real estate is starting its long decline from euphoric fantasy to reality, plummeting values of both the real property and the financial house of cards erected on the property are erasing trillions.

How do you extract the capital from a rapidly depreciating asset? It's human nature to hope "things will turn around next year." Unfortunately, real estate will not turn around next year, or the year after that or the year after that. Real estate has become a capital sink for the national savings.
Yes, large global U.S. corporations are sitting on a cash horde of $1.4 trillion or so; and that begs the question: what are they waiting for? Isn't there any capital project profitable enough to justify investment? Apparently not. If you're counting on global U.S. based corporations to "save the country" via wise investments in new goods and services, don't hold your breath. Many companies have "invested" their billions of cash in share buybacks, essentially propping up their stock prices with artificial demand/ buying.

How pathetic is our state of affairs when "investing" in bubble-valued real estate and stock buy-backs is so very much more profitable than investing in new production of real goods and services?

I have often recommended the three-book series Civilization & Capitalism, 15th to 18th Centuries by historian Fernand Braudel (The Structures of Everyday Life (Volume 1) , The Wheels of Commerce (Volume 2) and The Perspective of the World (Volume 3) ). One bit of history he described which continues to resonate is the re-allocation of capital by the Venetian merchants as their trading empire was eclipsed in the 16th century. Rather than battle for trading supremacy, the wealthy capitalists of Venice moved their capital onto the mainland, buying farms and agricultural production.

Why? This generated a higher return on capital, now that competition had rendered global trade less profitable. This marked the permanent decline of Venice from a global powerhouse of shipping, goods and capital to a backwater.

The point of the story? That capital allocated for short-term profit is supposedly the unerring "invisible hand" of the market--yet this allocation of capital for "highest current returns" to the exclusion of competition, trade and "soft power" led to the decline of Venice from a global center of wealth and growth equivalent to London, Tokyo or New York in its day, to a faded-glory tourist town.

Is there a lesson in this for the U.S.? Absolutely. Beware of Capital Traps for National Savings.

(The other two featured book recommendations this month are Tragedy & Hope: A History of the World in Our Time and How The World Really Works )

NOTE: contributions are humbly acknowledged in the order received. Your name and email remain confidential and will not be given to any other individual, company or agency.

Thank you, Eugenio M. ($20), for your second generous contribution to this humble site. I am greatly honored by your support and readership. All contributors are listed below in acknowledgement of my gratitude.
Read more...

Tuesday, April 08, 2008

Pareto Principle: Triggering the New American Revolution

Yesterday I posited that 4% of the American middle-class falling into poverty will have an outsized influence on 64% of the remaining middle class. I also suggested that when 20% of the middle class has seen their wealth and benefits shrivel to near-zero then 80% of the middle class will join the uprising which I call the New American Revolution (TM).

(OK, the trademark is a poke at the marketing universe's obsession with "branding" everything for marketshare/mindshare/profit. How about charging a royalty for any use of the term? If the trademark application passes the hurdles...)

Today let's consider the drivers of middle-class impoverishment and the psychology of hope/entitlement being smashed.

1. the crash of home equity to zero or less than zero. Stories are popping up in which "upper middle-class" people with homes which were recently worth $800,000 to $1.4 million being shocked that their home equity lines of credit have been cancelled: Lenders retreat as housing market plummets.

What is remarkable about these stories is the owners' strong sense of entitlement-- that the "free money" doubling or tripling of their equity in the bubble was now "theirs" for all time, and that it should be available, as it was from 2002-2006, as a permanent "slush fund" for their home improvement projects, new cars, etc.

These folks are shocked, shocked, that their homes could drop by $400,000 or more--after all, this is a "good neighborhood where house prices never drop." In other words, the operating preconception of the upper middle-class is that a decline in equity is limited to ghettos and tacky exurbs. The market is proving this preconception false.

So let's state this very clearly: equity dropping to functional zero (i.e. you can no longer extract any equity regardless of your personal beliefs about your home's value) is not limited to subprime/toxic/liar-loan mortgage holders.

Another very common situation is the middle-class household which has owned their home for years or even decades, and as a result had built up significant home equity. But then college, divorce, a job loss, extended illness, parent-care or some other major life expense came up and the family extracted the equity to handle the crisis/costs.

Like almost everyone else, they didn't worry too much because the bubble was continually granting them more equity every year. But now that values are plummeting, their remaining equity has dropped to zero.

Let's also be clear about the distinction between theoretical equity and extractable equity. Let's say a house was worth $200,000 at the top of the bubble in Q4 2005/Q1 2006, and the owners had refinanced/HELOC'd up to a $160,000 mortgage. They feel very secure holding 20% equity.
Oops, home values drop 10%--yes, even in their "nice neighborhood with good schools." Their residence is now worth $180,000 and equity has dropped to $20,000. Still, that's a nice "safety cushion", right?

Only there's a big, ugly fly in the ointment: no lender is dumb enough to extend them credit based on the last 10% of equity. The banks have finally caught on to risk and the bubble popping, and their "risk models" have been adjusted to the likelihood that the house could drop not just another 10%, wiping out all the remaining equity, but 15% or more, putting the owners (and any lender dumb enough to have extended them additional credit) underwater.

This is important: the homeowner may reckon they still hold theoretical equity of 20%, but their extractable equity is zero. Lenders are rushing back to the 20/80 model in which a 20% down payment is considered prudent, and so 20% equity is essentially zero.

Please don't email me that your credit score is 800 and there's a lender right now willing to lend you 90% of the value of your mansion. That may well be, but the average middle-class household doesn't have a credit score of 800. You are an outlier, just like the person who plunks down 50% cash when purchasing a house. Sure, such buyers exist, but we're talking about 50-60 million households' typical circumstances, not the outliers.

To summarize: here are the middle-class households who are in danger of losing all their extractable equity:

Any family which put less than 20% down when they purchased their house in the 2002-2006 time frame.

Any family which extracted equity during the bubble such that their equity was reduced to 20% by 2006.

Any household in bubble hotspots (Florida, California, etc.) with 20% remaining equity as of Q1 2008 (present).

Various pundits are amusing themselves with guesstimates of "how much more housing will drop before we hit bottom" and numbers of 15% (laughably optimistic) are being tossed about. As more knowledgeable commentators have noted, "reversion/regression to the mean" suggests another 40% - 60% decline in house prices is likely.

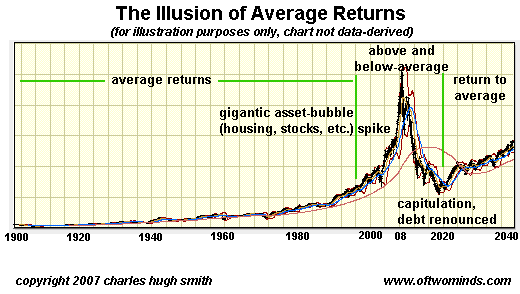
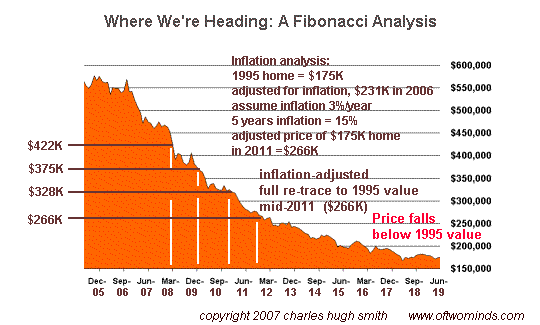
Here are two charts which illustrate the point: (see below)


In the first, the sharp peak is the bubble--the dot-com era tech stocks, or the housing bubble's home prices. Statistically, prices tend to revert to their starting point.
In the second chart, we see how a house purchased for $175,000 in 1995 whose apparent "rise" in value to $266,000 in 2011 is totally a result of a modest 3% annual inflation. If this house drops below $266,000 in 2011, then the owner has effectively lost value, regardless of the nominal price increase.

Yesterday we posited a Pareto Principle effect would kick in once 4% of the middle class suffered financial losses which impoverished their family. Have 2.4 million (4% of 60 million) households already suffered a complete loss of equity? By most accounts, homeowning households with zero or negative equity already exceed 8.8 million--over 10% of all U.S. homes.

Moody's Economy.com estimates that 8.8 million homeowners -- about 10.3% percent of all U.S. homes -- will have zero or negative equity by the end of this month. Another 10-15 million households are at risk of becoming "upside down" if prices continue falling. So we almost have our Pareto principle (20%) number: if prices keep falling (a given) then somewhere between 20% and 30% of all homeowners will have negative equity.
2. The other 800-pound gorilla in the fiscal-crisis room is healthcare. The Powers That Be are reluctantly admitting that a recession is underway. And what happens in a recession? Spending slows and businesses either fold or lay off employees to cut expenses.

And what happens when you get laid off? You lose your healthcare benefits. And what separates the poor from the middle-class? Healthcare benefits. Once the middle class starts losing jobs and healthcare, without equity they are essentially impoverished.

Self-employed people like me know how incredibly costly healthcare is, either cash or insurance bought on the "open market." The average salaried worker has no idea just how much it will cost to duplicate their employer-provided health insurance in the "real world."

Sure, if you're 25 and single, your health insurance is minimal, on the order of $150/month. But if you're middle-aged with kids, try $700-$1,000/month depending on how gold-plated your insurance coverage is.

Here's the key question: how many middle-class workers will lose their jobs in this recession? The official unemployment numbers are nearly useless for a variety of reasons, but let's start with the "official unemployment rate" of 5%. In an economy of 130 million jobs, that's about 6.5 million people.

Now millions more work in the underground (cash) economy, and millions more have exited the job market/given up/retired early/taking care of grandchildren but would like a part-time job, etc.

In good times, most of the unemployed are "in between" jobs; most find another job within 6 months. The "hard-core" unemployed--those saddled with felony convictions, low education, addictions, poor health, etc.--are another story, one we'll set aside for now. But in bad times, i.e. recession, people don't find another job. Then they drop off the "official statistics" and essentially disappear.

Thus we may be presented with an "official" unemployment rate which no longer counts millions of laid-off workers who once had middle-class jobs. If you're unemployed longer than 6 months, you're no longer counted. If you take a part-time job "just to tide the family over" then you're employed. If you take an occasional temporary gig (temping), then you're employed, too.

But if your family loses its healthcare coverage in a job shuffle, then you're no longer in the middle class. You're one of the working poor now. As we all know, the key to survival as a middle-class American is: someone in the family has to have healthcare benefits which cover the entire family. If nobody has healthcare benefits, then the family income has to be high enough to afford $700-$1,000+ per month for insurance plus in most cases a 10-20% co-pay.
How many middle-class U.S. households can lose one wage earner's paycheck and be able to pay a new $800/month bill? Very very few.

In the Good Old Days, practically every corporate job provided healthcare coverage. Now is not the Good Old Days. If you're lucky to merely get laid off as opposed to losing your job when your employer goes out of business, you might get hired back on a "temp" or contract basis. Nice, but no benefits.

The fortunate families are those in which one wage-earner works for a government agency or municipality. The government gigs always provide gold-plated coverage for the family, so these folks have no worries--until the agencies and cities start laying off workers as tax revenues shrivel. Millions of homeowners are rushing to have their property taxes lowered as real estate values drop, and the net result is a dramatic decline in tax revenues.

So what I am suggesting is this: 20% of the middle-class--approximately 10 million households--could lose their middle-class status via home equity declines and loss of healthcare coverage, even as the "official unemployment" number provided a Potemkin-Village assurance that "unemployment is still low."

10 million households sounds like a lot, but let's recall that there are 130 million jobs at present. If 10 million people lost their jobs, that would be a 7.6% unemployment rate--not even close to the "official rate" in the 1981-82 recession of over 11%.

As we consider how 20% of the middle class could drop into the zero-equity working poor, let's note the following:

First, the loss of one benefits-rich job in a two-wage earner family is more than sufficient to drop the family from middle-class to working poor.

Second, even if both wage earners manage to hold onto jobs, if a jobs shuffle results in a loss of healthcare, then the result is still "working poor" status unless the family income can afford a $700-1,000/month insurance bill they never had to pay before.

Third, let's state the obvious: a temp/contract/part-time job is not equivalent to a fulltime position with full benefits, yet officially the two are equivalent: you're employed, buddy, that's all we care to count.

Fourth, the low-income poor have access to government entitlements such as school lunches and some healthcare coverage. If you fall completely into poverty, and are willing to grind through the paperwork needed to qualify, then you can have some of your benefits restored--though not the shiny middle-class variety you were used to. But if your income remains middling, then you fall into the Gap of Heck: too much income to qualify for low-income benefits but not enough to pay for middle-class perks like full healthcare insurance, 401K contributions, overseas vacations, etc.

Fifth, it is precisely the formerly middle-class workers who are most likely to drop off the official stats. The working poor are already in the lower rungs of the economy, and while they will suffer as restaurants and other service-rich businesses close, they are less likely to become contract workers, consultants, etc. and less likely to start a small business--all avenues formerly middle-class wage earners tend to pursue when finding a job equivalent to their old one becomes The Impossible Dream.

Sixth, let's recall that about 27% of U.S. households are low-income, and 32% of all the people filing income tax forms pay no Federal income tax. (See yesterday's entry.) If 10 million people are officially unemployed, how many are working poor and how many are/were middle class? That is a tricky calculation, but back-of-the-envelope suggests that if there are 10 million unemployed, 7 million are/were middle-class.

If unemployment rises to 10% or more, as it did in the 1981-82 recession, then that is about 13 million people out of work/looking for a job. If 70% of those folks are/ were middle-class, you have 10 million middle-class people in danger of falling into the working poor.

To summarize: an official unemployment rate of, say, 7.5% could easily mask a reality in which 10 million formerly middle-class households are now in the ranks of the working poor.


Now let's discuss the middle class sense of entitlement. For a variety of reasons-- mostly stupidity and general orneryness--I have been self-employed/operating a small business for most of my working life. Those of you in the same boat know the drill--your sense of entitlement is pretty limited. You hope for customers, and try to take care of those you have. You pay outrageous taxes and fees for the privilege of retaining modest freedoms, and are used to paying for everything: your own medical care and insurance, your own retirement (if any), and all the rest.

It's still a free market when you're in business for yourself. Businesses go under and wipe out the owner's savings, livelihood and esteem on a regular basis, even in good times.

Writing payroll deduction checks to the Feds every week for your employees' tax witholdings--five figures on those checks, my friend--gives you a different perspective, to be sure. So does paying your employees medical insurance, Workers Compensation, Temporary Disability and unemployment insurance costs. After years of that I am now happily a sole proprietor--no employees, just quarterly taxes and gargantuan property taxes to pay. It's like child play compared to the benefits costs for employees. Sure, my net income is poverty level, but life is a trade-off.

For the self-employed, entitlements are reserved for the poor and the elderly; we're the ones who are paying for the entitlements, not receiving them.

But those who have had good-paying jobs in the corporate or government sectors seem to be prone to "creeping entitlement" disease, in which healthcare and other benefits are "rights," along with rising equity and 401K retirement accounts.

The loss of benefits and middle-class status will not pass unnoticed. Heck hath no fury like an entitled person scorned, and people who were born to expect a lifestyle equal to or better than their parents will not go quietly into the night when they have to stand in line at the county hospital for healthcare, like all the other working poor.

Instead of ever-rising equity and the HELOC every year or two for new cars, fancy vacations and all the other luxe perks of the bourgeois, now they find themselves scraping by with no equity, a shrinking retirement (if they haven't pulled it out already) and insane medical bills. Sure, bankruptcy is a solution, but where does that put you? More or less on square one in a recessionary economy.

Here is the clincher: the poor don't vote, and the young don't vote, but the middle class votes. The poor are either too busy being poor or too overwhelmed by problems to have time for luxuries like political organizing. The wealthy just move to Costa Rica or stop reading the paper for awhile because it's "depressing." But the middle class is used to having a voice, and being heard by politicos is one of their entitlements.

Marx expected the proletariat (factory worker) to rise up, but he was wrong; political movements such as unions and regulations on "The Jungle" of rapacious Capital effectively co-opted the Revolution Marx forsaw. So who co-opts an angry, suddenly disenfranchised middle class? Unions? Regulatory improvements? A third political party?

I don't have an answer, but the Pareto Principle suggests that when the middle class sees their friends and co-workers descend into the working poor, and they sense their own systemic vulnerability to the same fate, then a politically righteous anger will arise which cannot be ignored or brushed aside with the usual phony PR shows and regulatory touch-ups like "medical savings acccounts."

Brilliant! Here you have 10 million households with no savings and a huge decline in income, and you set up "savings accounts" with "tax credits." So 50 million people won't owe any tax instead of only 42 million not paying a dime, and that's going to solve the U.S. healthcare crisis? That is beyond laughable.

Is it possible the middle class won't fall for the usual shuck and jive, that they will finally demand real change, and vote out the usual suspects of both parties as the toadies they are? Perhaps not, but I wouldn't underestimate the staying power and the welling rage of those who feel entitled to what is no longer attainable in the Current Political and Financial System.

This is the same human characteristic which might cause China to convulse in social disorder in the coming decade: when hopes for a better, more luxe life die, they die hard, and they take down the political structure which led to hope's demise.

Readers Journal has been updated, with 30 new Readers commentaries on a huge range of great topics and three new incisive, fascinating essays (links to your right); Read them all!
Also, check out a new feature in the right sidebar below Readers Journal, "This Month's Highlighted Books."

Read more...

Monday, April 07, 2008

Will Delinquencies Trigger a New American Revolution?

Two years ago I predicted we'd soon see 5 million foreclosed/distressed homes, 5 million REO/investment/2nd homes languishing on the market and lender/thrift losses of $500 billion. I seem to have undershot the losses, but how many analysts/pundits/ media types are on record in April 2006 with predictions like these?

Foreclosures and Financial Ruin: How Bad Will It Get? (April 26, 2006)
How Many Foreclosures Will Hit the Market? (May 1, 2006)

I went on to posit that the Pareto Principle suggested that a mere 4% of homeowners could influence 64% of all housing's value: Can 4% of Homeowners Sink the Entire Market? (February 21, 2007)

And here we have it: The delinquency rate for all mortgages climbed to 5.82 percent in the fourth quarter. Since housing has in aggregate dropped some 15% since I wrote that entry, it certainly seems to bear out a 4/64 Pareto effect.

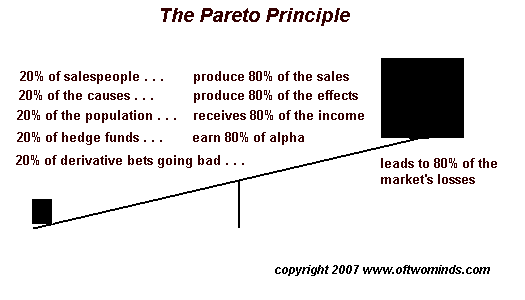
The Pareto Principle we are familiar with is the 80/20 rule: 20% has an outsized influence on the 80%.

And now we see the magic 20% number has been hit in subprime mortgages: Mortgage delinquencies hit 23-year high (March 6, 2008)

The delinquency rate for all mortgages climbed to 5.82 percent in the fourth quarter. That was up from the 5.59 percent in the third quarter and was the highest since 1985. Payments are considered delinquent if they are 30 or more days past due.

Homeowners with tarnished credit who have subprime adjustable-rate loans were the hardest hit. Foreclosures and late payments for these borrowers also swelled to all-time highs in the fourth quarter.

The percentage of subprime adjustable-rate mortgages that entered the foreclosure process soared to a record of 5.29 percent in the fourth quarter. That was up from 4.72 percent in the prior quarter, which had marked the previous high. Late payments skyrocketed to a record high of 20.02 percent in the fourth quarter, up from 18.81 percent — the previous high — in the third quarter.

The association's survey covers almost 46 million home loans nationwide. I now suggest that when housing-related losses in equity and recessionary job losses stemming from the credit/housing-bubble debacle impoverish 4% of middle-class Americans, that will heavily influence 64% of the remaining middle-class.

And when 20% of middle-class Americans have suffered significant financial losses in equity, income and benefits, that will trigger a New American Revolution (TM)--a bloodless revolution, but a Revolution nonetheless.

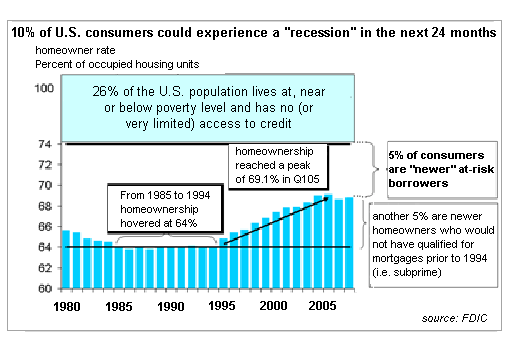
So how many people are in the American middle-class? Let's start with a diagram courtesy of the FDIC on home ownership, for that is a fairly reliable guide to membership in the middle class. Why? Not only is a house the basis of most family's wealth, it is also the bedrock of retirement and whatever wealth the older generation can pass on to its children and grandchildren.

What this graph reveals is that home ownership peaked at 69% in the bubble, and the 5% who really couldn't afford to buy a house except with exotic/toxic subprime/no-doc/etc. loans, will likely lose their homes as the recession deepens, dropping homeownership back to its historical average of about 64%.

Please note that many who are losing their homes bought long ago with conventional loans. But since they extracted most of their equity during the bubble via refinancing and HELOCs (home equity lines of credit), they are now as underwater as the subprime buyers who bought a house with no money down.

So how many people are we talking about when we posit that 20% of the middle-class dropping into financial insecurity will spark a political uprising?

Let's refer to:
Income Inequality (Middle Class) - Narrative (US Census Bureau)
American middle class (wikipedia)
US Census Bureau QuickFacts
Financial Services factbook

I know this is mind-numbing, but we're talking numbers so we have to source all this and put it together. Let's summarize the big numbers:
population of the USA: 303 million (as per US Census website, link above)
number of households: 105 million
Housing units: 126 million
primary residence single-family houses: 75 million (25 million owned free and clear, 50 million mortgages)

Second-Home Market Surges, Bigger Than Shown in Earlier Studies (March 2005):

An examination of 2003 data from the Census Bureau shows there are 43.8 million second homes in the United States, including 6.6 million vacation homes and 37.2 million investment units, compared with 72.1 million owner-occupied homes. As with all data from various sources, it's easy to get confused. Let's note that almost two million new housing units were built every year during the bubble-boom, so that explains how 2003 data can list 72 million owner-occupied homes and later data states 75 million.

Let's also note that the Census Bureau's 126 million "total housing units" includes second homes, investment units and large multi-unit apartment complexes.

Interestingly, there are 20 million vacant dwellings in the U.S., of which only 7 million are vacation homes. So much for any perceived "shortage" of housing, of any type.

Now let's turn to Summary of Latest Federal Individual Income Tax Data.

There are 132 million tax returns filed, which not surprisingly is about the same number of jobs in the "official" (non-black market/undocumented worker) economy.

42 million file a return but don't pay a dime. 90 million file and pay something. The top 1 percent of taxpayers (income over $364,657) earned approximately 21.2 percent of the nation's income yet paid 39.4 percent of all federal income taxes.

90.6 million of the tax returns came from people who paid taxes into the Treasury. That leaves 42 million tax returns filed by people with positive AGI who used exemptions, deductions and tax credits to completely wipe out their federal income tax liability.

The top-earning 25 percent of taxpayers (AGI over $62,068) earned 67.5 percent of the nation's income, but they paid more than four out of every five dollars collected by the federal income tax (86 percent). The top 1 percent of taxpayers (AGI over $364,657) earned approximately 21.2 percent of the nation's income yet paid 39.4 percent of all federal income taxes. That means the top 1 percent of tax returns paid about the same amount of federal individual income taxes as the bottom 95 percent of tax returns. The top 10% of taxpayers earn 46% of the total gross income.

OK, let's put this all together. 26% of the nation's population is at or near poverty level. That's about 27 million households. (Let's use households rather than population because it correlates to housing units. These low-income wage earners-- 42 million--pay no taxes.)
13 million taxpayers earn almost half the total gross income, so let's call them wealthy, i.e. "not middle-class." Some households have two such earners but just for simplicity let's say 27 million households are impoverished and 13 million are wealthy, which leaves 65 million households in the middle-class.

That aligns rather nicely with the FDIC homeownership rate, which states there are about 67 million homeowners.

Other analysts (see above links) place the number of middle-class households at 50 million, which may be more accurate. Consider who owns their home free and clear; some are wealthy households, no doubt, but many are elderly retirees who paid off their 30-year conventional mortgage and who may now be living on modest "non-middle-class" incomes. (The median household income in the U.S. is about $46,000/year).

Since there are about 25 million homes owned free and clear, we can surmise that many are owned by people who are old enough to have paid off their 30-year mortgages and are now living on Social Security and pension/retirement incomes.

If so, we have to divide the 65 million middle-class homeowners into those who are receiving government entitlements (Social Security and Medicare) and those who are paying through the nose in taxes.

So let's posit that there are about 50-60 million middle-class taxpaying homeowners/ households. There are about 50 million mortgages, and that aligns pretty well with the guesstimate of 50-60 million middle-class households.

According to the Pareto Principle, 4% of the middle-class losing their equity, jobs and healthcare will have an outsized effect on 64% of their brethren. That suggests that once as few as 2 million formerly middle-class households lose their equity (they could hang onto paper ownership of their home, but if their mortgage exceeded the value of the house, then their wealth has effectively vanished), or their jobs and healthcare, then a political earthquake will be unleashed.


And once 20% of the middle-class --10 million households--have experienced major degradation in equity, income and healthcare benefits, then the New American Revolution (TM) will begin.

What shape will the revolution take?

I think it is safe to say the New Revolutionaries will demand that a distinction be drawn between investment bankers making $300 million each for playing around with risky leveraged paper and true entrepreneurship, i.e. real people starting businesses which produce tangible goods and services and "real-world" meaningful innovations.

I would guess that the new Revolutionaries will demand a government which lives within its means, and thus the government must scale back entitlements which are unaffordable.
I also suspect that many of the New Revolutionaries will demand a currency backed by precious metals.

I would imagine/hope the New Revolutionaries would see the wisdom of regulations, transparencies and checks and balances to rein in the worst excesses of human greed, avarice and duplicity, just as American Revolutionaries in previous generations so wisely did.
You would be completely justified for reckoning my prediction of Middle-Class Political Revolution as absurd, wild, etc.--but then look at how well the Pareto Principle predicted the housing bubble's consequences.

More on this topic tomorrow--

Readers Journal has been updated, with 30 new Readers commentaries on a huge range of great topics and three new incisive, fascinating essays (links to your right); Read them all!
Also, check out a new feature in the right sidebar below Readers Journal, "This Month's Highlighted Books."

Read more...

Terms of Service

All content on this blog is provided by Trewe LLC for informational purposes only. The owner of this blog makes no representations as to the accuracy or completeness of any information on this site or found by following any link on this site. The owner will not be liable for any errors or omissions in this information nor for the availability of this information. The owner will not be liable for any losses, injuries, or damages from the display or use of this information. These terms and conditions of use are subject to change at anytime and without notice.

RE: European Union AI Act, and Our Use of Generative AI Tools and Agents Policy

All text on this site is composed by Charles Hugh Smith or by a credited guest-author. No Generative AI Tools are used in the composition / writing of any text or graphic content created by Charles Hugh Smith. This site deploys no AI agents or generative AI tools. This site is not responsible for the disclosures, use or non-use of AI agents or generative AI tools in advertisements displayed by Investing Channel or other ad placement services.

Audio files generated by text-to-audio transcription tools are identified as such.

Our Privacy Policy:

Correspondents' email is strictly confidential. This site does not collect digital data from visitors or distribute cookies. Advertisements served by third-party advertising networks such as Investing Channel may use cookies or collect information from visitors for the purpose of Interest-Based Advertising; if you wish to opt out of Interest-Based Advertising, please go to Opt out of interest-based advertising (The Network Advertising Initiative) If you have other privacy concerns relating to advertisements, please contact advertisers directly.

PRIVACY NOTICE FOR EEA INDIVIDUALS

This section covers disclosures on the General Data Protection Regulation (GDPR) for users residing within EEA only. GDPR replaces the existing Directive 95/46/ec, and aims at harmonizing data protection laws in the EU that are fit for purpose in the digital age. The primary objective of the GDPR is to give citizens back control of their personal data. Please follow the link below to access InvestingChannel's General Data Protection Notice.
https://stg.media.investingchannel.com/gdpr-notice/

Notice of Compliance with The California Consumer Protection Act

This site does not collect digital data from visitors or distribute cookies. Advertisements served by a third-party advertising network (Investing Channel) may use cookies or collect information from visitors for the purpose of Interest-Based Advertising. If you do not want any personal information that may be collected by third-party advertising to be sold, please follow the instructions on this page: Do Not Sell My Personal Information.

Regarding Cookies:

This site does not collect digital data from visitors or distribute cookies. Advertisements served by third-party advertising networks such as Investing Channel may use cookies or collect information from visitors for the purpose of Interest-Based Advertising; if you wish to opt out of Interest-Based Advertising, please go to Opt out of interest-based advertising (The Network Advertising Initiative) If you have other privacy concerns relating to advertisements, please contact advertisers directly.

Our Commission Policy:

Though I earn a small commission on Amazon.com books and gift certificates and gold (BullionVault) purchased via links on my site, I receive no fees or compensation for any other non-advertising links or content posted on my site.

Copyright Notice:

All original images (Drawings and Photographs), text (essays, books and works of fiction), audio and video recordings, musical compositions, graphic design, graphic design elements and HTML coding on this site are the copyrighted work of Charles Hugh Smith unless otherwise credited or noted. They are published as information for the private use of site visitors, and any reproduction or redistribution of this content or coding in any media in any format or distribution channel (text, audio, video/film, web) without the written permission of the copyright holder is strictly prohibited. All rights in all media reserved globally.

  © Blogger templates Newspaper III by Ourblogtemplates.com 2008

Back to TOP