Saturday, April 30, 2011

Peak Oil and Soil

The causal connections between Peak Oil, soil and food are key to understanding the risks facing the nation and world.


There are dozens of timeless guest essays in the thousands of pages of oftwominds.com archives, and I want to share some of them with new readers.
Peak Oil and Soil (August 1, 2007) by Eric Andrews is a wonderfully succinct explanation of the connection between Peak Oil and its offspring, Peak Soil and Peak Food. Relying on the centralized powers of Big Agriculture and Big Government to "save us" might not be a wise strategy; there are decentralized paths to a less risky, more sustainable mode of food production.


Here are the first few paragraphs; click on the link to read the full essay.


When discussing the value of soil especially in the context of Peak Oil, the devil is in the details.
There are two parts to this:First is that readers may not realize the gravity of the situation concerning food and Peak Oil. There is a wing of the Peak Oil argument that statistically demonstrates how food presently can be said to be a form of oil. Numbers run as high as 10 calories of oil per calorie of food, which with 2,000 mile Caesar salads from California and 10,000 mile apples from New Zealand, is not hard to believe.
In fact, every step of the food chain rests entirely on oil and cheap energy: seed production and storage; plowing and planting via diesel tractors; irrigation of the desert by diesel pumps; fertilizer created from natural gas, without which tired fields that have no natural tilth or manure could not otherwise produce; pesticides and herbicides created from oil and applied with tractors; the harvest by diesel combine and shipped by semi from remote areas; the drying of grain or year-round cold storage; shipping by truck center to the mill and then the grocery where coolers and air conditioning with computer registers and just-in-time inventory again support the entire process.
In fact, there is less than a week’s supply of food in the entire food chain, while consumers—in contrast to America before 1960--hold less than a week’s worth of food at home in their refrigerators.
The “Green Revolution”, which ended the famines of the 70s, could arguably be said to be a result of eating oil. The logical conclusion is that without cheap oil, we must again return to those times, except with 1/3 more population.


Excerpted from Peak Oil and Soil.


Readers forum: DailyJava.net.


Order Survival+: Structuring Prosperity for Yourself and the Nation (free bits) (Mobi ebook) (Kindle) or Survival+ The Primer (Kindle) or Weblogs & New Media: Marketing in Crisis (free bits) (Kindle) or from your local bookseller.

Of Two Minds Kindle edition: Of Two Minds blog-Kindle


Thank you, Carl T. ($5/mo), for your wondrously generous subscription to this site-- I am greatly honored by your support and readership. Thank you, David D. ($10), for your much-appreciated generous contribution to this site-- I am greatly honored by your support and readership.

Read more...

Friday, April 29, 2011

Do These Charts Look Like "Recovery"?

House prices in desirable areas are declining, contradicting the "recovery" story.


Without speculating on where housing valuations "should" be, what's your takeaway from these charts of individual home prices? Does this look like a "recovery" to you? Since everyone knows "real estate is local," I selected three homes in very desirable but not overly exclusive neighborhoods with excellent school districts and a history of strong price appreciation: two in Northern California and one in the Greater Boston region.


For context, here is the most recent Case-Shiller Index, which shows national home prices declining to 2003 levels. This chart traces a classic "bubble" with the top around the first quarter of 2007, followed by a sharp decline and a period of stabilization as the Federal Reserve and the Federal government intervened to support the housing market in an unprecedented fashion--buying $1.1 trillion in mortgages, issuing tax credits to buyers, etc. etc.


Recently, the index turned down again, the dreaded "double dip."


Interestingly, the charts from highly desirable neighborhoods have much different characteristics. The top of the bubble valuations occurred in a timeframe stretching from 2005 to 2008. There was no sharp decline in price, followed by a plateau; prices have dropped grudgingly but steadily from their apex.


Prices are still in a free-fall, and there is still plenty of room left on the downside to fully retrace the bubble. The cliche is that housing prices are "sticky" and decline slowly. While prices have been dropping for a few years, the decline seems to be accelerating rather than stabilizing.


If we had to characterize the difference between the national chart and these left/right coast homes in desirable, upper-income areas, we'd have to say there was not much of a plateau, that price has "only" returned to 2004 levels and that declines accelerated in 2010.


Here is a home that was completely renovated in 2002-3 in a middle-class suburb of San Francisco. The green line reflects the town's pricing history.


This home is in the highly desirable "hills" of a San Francisco-area suburb, a desirability reflected in the bubble valuations above $1 million. The green line is the town's price history, the yellow is the zip code's price history. Clearly, some pricey sales in the neighborhood caused the value of this home to spike.


Good schools and proximity to jobs--what's not to like in this Boston-area suburb? Strong price appreciation continued into early 2008, but since then price has fallen 22%.


My takeaway is that price depreciation in these desirable areas has been orderly, but that it is far from finished. What I see is price surrendering in late 2010 as the "recovery" story loses credibility.


The "story" in desirable neighborhoods has been that "there was no bubble here" or "prices aren't falling." The declines have certainly been less severe than those experienced by bubblicious areas where prices rose on pure speculation. BUt the fact that prices continue to weaken even as the "recovery" is supposedly gaining steam should give believers in the "recovery" story pause.


2010 was the perfect opportunity for housing in desirable areas to turn up. Instead, price declines accelerated to the downside despite record-low mortgage rates and a supposedly "firming" economy. It looks as if home buyers are voting on the "recovery" story with their feet.


Readers forum: DailyJava.net.


Order Survival+: Structuring Prosperity for Yourself and the Nation (free bits) (Mobi ebook) (Kindle) or Survival+ The Primer (Kindle) or Weblogs & New Media: Marketing in Crisis (free bits) (Kindle) or from your local bookseller.

Of Two Minds Kindle edition: Of Two Minds blog-Kindle


Thank you, Hudon C. ($5/mo), for your terrifically generous subscription to this site-- I am greatly honored by your support and readership. Thank you, Mike K. ($100), for your outrageously generous contribution to this site-- I am greatly honored by your support and readership.

Read more...

Thursday, April 28, 2011

Bernanke's Press Conference, August 1, 2012

In which a parrot replaces Ben Bernanke, who shows up late looking OD'ed on Ibogaine.


August 1, 2012: Federal Reserve Chairman Ben Bernanke once again defended the Fed's accommodative monetary policy at today's press conference. Mr. Bernanke was late to the conference, which was shielded from protesters by riot police.


In his absence, a pet parrot was brought out to amuse the waiting journalists, who had been carefully vetted by the Fed to "represent the nation's media." The parrot had apparently occupied a perch in the Fed's conference room, for it repeatedly squawked, "Stocks are up, stocks are up."


The Fed chairman finally emerged sometime later, looking somewhat distracted. Recent developments in the global economy have cast a shadow on the Fed's continuation of zero interest rates and quantitative easing, the term describing direct purchases of assets such as mortgages, Treasury bonds and stocks.


As the dollar continued its slide, unemployed German workers shouted "Death to America" in mass protests in Germany's industrial heartland. With the euro worth $2, German exports to the U.S. have shriveled, causing a sharp contraction in the once robust German economy.


In Japan, the 7th government in six months took power, vowing to continue fiscal stimulus, despite the failure of the policy. The dollar's decline has crushed Japanese exports to the U.S., as the dollar fetches only 55 yen, far below the breakeven point for Japanese exporters.


Japan's new prime minister voiced support for the quatloo, the new petroleum-backed currency being touted by Saudi Arabia, China and PIMCO as a global alternative to the U.S. dollar.


China's military deployed to 15 additional cities to quell the protests over rising food and energy prices. As the Chinese economy spiraled into that nation's first deep contraction, China's leadership continued to blame the Fed's policies for crushing the dollar and driving up commodity prices.


Since the Chinese currency is linked to the dollar, then skyrocketing commodity costs caused by the sinking dollar are also affecting the Chinese economy.


Just before the Fed press conference, President Obama announced that he was closing the commodity futures exchanges "to eliminate these speculators once and for all." He also announced that any farmer caught "hoarding grain" would face confiscation of the grain by Federal authorities.


"We have to stamp out these evil speculators, whatever it takes," the President said from the safety of the White House, which has been surrounded by angry mobs protesting $10 per gallon gasoline.


Gasoline suppliers responded to the closing of the futures exchange by raising the cost of fuel from $10 per gallon to $11 per gallon.


Sweating profusely, Mr. Bernanke repeated the same message he's been giving the nation for over a year: zero interest rates and Fed purchases of assets to keep interest rates low would eventually create more jobs in the U.S., and the dollar would strengthen as foreign investors flocked to the U.S.


Some observers have noted that this is at odds with the government's restrictions of foreign ownership of U.S. assets, following China's attempt to buy the bankrupt state of California earlier this summer.


The Fed chairman also pointed to the Dow Jones Industrial Average surpassing 20,000 as evidence that the Fed's policies were "working as planned." A recent Bloomberg analysis of the low-volume market meltup found that most of the volume on recent trading days resulted from the trading of a single block of SPX shares, which were traded 4,200 times by primary dealers and then purchased by the Fed at the top tick of the day.


Ignoring questions from financial media outlets, Mr. Bernanke took a question from theUFO Weekly representative on the Fed's views about Area 51 and alien spacecraft. Mr. Bernanke replied that alien spacecraft could handle the job of dropping money as well as helicopters, and then veered into a rambling discussion of the importance of managing perceptions, at one point shaking his fist and saying, "If only they knew the power of the Dark Side."


To the consternation of onlookers, the chairman then vowed to "crush the bears, all of them" and said "you will see Dow 36,000 sooner than you can possibly imagine."


When a heckler asked about rising grain prices, Mr. Bernanke shot back, "Let them eat stocks."


After the chairman was led away by aides, some who had witnessed his erratic behavior and tirade noted an uncanny resemblance to those suffering from overdoses of the illegal drug Ibogaine.


In other news, President Obama continues to poll well in Washington, D.C. just a few months before the 2012 presidential election, but is trailing comic character Alfred E. Neuman in the rest of the country. Republican candidate Donald Trump's campaign declared bankruptcy, which Mr. Trump characterized as "a necessary step to greatness. Bankruptcy is the basis of any great business."


Long-term Treasury yields shot up to 18% as the market absorbed the possibility that once in office, Mr, Trump would pursue bankruptcy as a national policy.


Readers forum: DailyJava.net.


Order Survival+: Structuring Prosperity for Yourself and the Nation (free bits) (Mobi ebook) (Kindle) or Survival+ The Primer (Kindle) or Weblogs & New Media: Marketing in Crisis (free bits) (Kindle) or from your local bookseller.

Of Two Minds Kindle edition: Of Two Minds blog-Kindle


Thank you, Christine N. ($5/mo), for your much-appreciated generous subscription to this site-- I am greatly honored by your longstanding support and readership. Thank you, David S. ($5/mo), for your extremely generous subscription to this site-- I am greatly honored by your support and readership.

Read more...

Wednesday, April 27, 2011

The Housing Bubble Broke the Middle Class

The bursting of the housing bubble wiped out half of the net worth of the Mortgaged Middle Class.


On the face of it, American households were not that affected by the bursting of the housing bubble. If we look at the Fed Flow of Funds report, the Balance Sheet of Households and Nonprofit Organizations, we find that net worth only declined by about 11% ($7.3 trillion) from 2007 to 2010: a $2.9 trillion decline in financial assets and a $4.9 trillion decline in tangible assets, i.e. real estate and consumer durable goods.


Here are the basic numbers, rounded, in trillions:


total assets:
2007 $78.5 trillion
2010 $70.7


Liabilities:
2007: $14.4
2010: $13.9


Net worth:
2007: $64.2
2010: $56.8


Financial assets:
2007: $50.5
2010: $47.6


Tangible assets:
2007: $28.0
2010: $23.1


Most of the decline in assets results from the popping of the real estate bubble:$6.3 trillion of the $7.3 trillion decline is housing:


Real estate:
2006: $22.7
2010: $16.4


Despite massive write-offs from millions of foreclosures, mortgage debt barely budged:


Mortgages:
2007: $10.5
2010: $10.0


Ditto consumer credit, essentially flat: no deleveraging here:


Consumer credit:
2007: $2.55
2010: $2.43


This is a better reflection of the true devastation left by the bubble: I will explain why below:

Owners equity as percentage of real estate:
2006: 56.5%
2010: 38.5%


Despite the 100% rally off the March 2009 low, stocks and mutual fund assets are still down by a trillion dollars:


Corporate equities and mutual fund shares:
2007: $14.2
2010: $13.2


Households pulled money out of stocks and put it into Treasury bonds. Yeah, the public really bought the stock rally....


Treasury securities:
2007: $255 billion
2010: $1.0 trillion


Cash clicked up a bit:

Savings and money market funds:
2007: $7.2
2010: $7.5


On the surface, this rise in income looks good, too bad the increase is mostly Federal transfers of borrowed money:


Disposable personal income (SAAR):
2007: $10.4
2010: $11.5


If we look beneath the surface at the distribution of wealth, the picture isn't so benign. Over the years I have often posted the basic facts of wealth distribution and housing in the U.S., for example Will Delinquencies Trigger a New American Revolution?(April 7, 2008).


The numbers have changed from 2008, of course, but the basic outlines and percentages have not.


Beneath the surface, most of the income and wealth is held by the top 10% of households. Over a quarter of households are at or below the poverty line; they have no appreciable assets and depend heavily on government transfers.


Almost half of the total income (47%) goes to the top 10%, and 21% flows to the top 1%.


Over 18% of personal income is transfers from the Federal government, most of which is borrowed, of course: Reliance on Uncle Sam hits a record :

A record 18.3% of the nation's total personal income was a payment from the government for Social Security, Medicare, food stamps, unemployment benefits and other programs in 2010. Wages accounted for the lowest share of income — 51.0% — since the government began keeping track in 1929.


From 1980 to 2000, government aid was roughly constant at 12.5%

If we extrapolate the additional 6% increase in transfers, that comes to $700 billion. So roughly 70% of the increase in personal income was simply money borrowed by the Federal government (recall the $1.6 trillion annual Federal deficit) and distributed to the citizenry. In other words, people aren't making more money--the Central State is simply borrowing more and it's being counted as "income" when it's distributed.


There are about 105 million households in the U.S. and about 72 million owner-occupied dwellings. Roughly 25 million are owned free and clear, and 48 million have a mortgage.


Let's look at homeowner's equity, which stands at 38.5%. Equity is what's left if you sell your house and pay off the mortgage.


About 27% of all homeowners (13 million) are underwater, i.e. their house is worth less than their mortgage. This is called negative equity, but in practicality it means zero equity.


Since a third of all homes are owned free and clear, then their equity is 100%. Assuming a broadly even distribution of these homes owned without mortgages (most likely, the majority are owned by elderly people who paid off their mortgages), then we can conclude that 33% of total owner's equity resides in these homes owned free and clear.


That leaves 5.5% of total equity spread among the 35 million mortgaged homes which are not underwater.


Calculated another way: household real estate is worth $16.4 trillion, and there is $10 trillion in outstanding mortgage debt, so total equity is $6.4 trillion. One-third of homes are owned free and clear, so one-third of $16.4 trillion is $5.4 trillion. $6.4 trillion - $5.4 trillion = $1 trillion in equity spread over 35 million homes.


That's not much--roughly 1.8% of all household net worth.


The family house was the traditional foundation of household wealth. As for all those trillions in financial wealth--as we all know, 83% is owned by the top 10%.


So here's the reality: over one-fourth of all households are at or below the poverty line: 28 million.


The top 10%--10.5 million households--own the vast majority of the financial assets ($45 trillion)(the total owned by non-profits is not broken out).


The next 10% own 10% of this wealth, or about $4 trillion. So the top 21 million households own 93% of all financial wealth.


The Great Middle Class between those in poverty and the top 20%--56 million households-- owns about $2.7 trillion in financial wealth, and the millions with mortgages own an additional $1 trillion in home equity. That comes to $3.7 trillion, or about 6.5% of the total household net worth.


Consumer durables--all the autos, washing machines, jet-skis, etc.--are worth about $2.2 trillion ($4.6 T = $2.4 T in consumer debt). Add the durables and the other wealth, and the Great Mortgaged Middle Class holds about 10% of the total household wealth ($5.9 trillion).


Before the housing bubble, households owed about $5 trillion in mortgages. The housing bubble came along, introducing the fantasy of home-as-ATM-cash-withdrawal-machine, and mortgages ballooned to over $10 trillion.


Back at the top of the bubble, the middle class had $6 trillion more assets on the books. Considering the Mortgaged Middle Class now owns about $6 trillion in net assets, then the bursting of the housing bubble caused their net worth to drop by 50%.


I'm not making any political statement here--these are the numbers.


Readers forum: DailyJava.net.


Order Survival+: Structuring Prosperity for Yourself and the Nation (free bits) (Mobi ebook) (Kindle) or Survival+ The Primer (Kindle) or Weblogs & New Media: Marketing in Crisis (free bits) (Kindle) or from your local bookseller.

Of Two Minds Kindle edition: Of Two Minds blog-Kindle


Thank you, William D. ($5/mo), for your extremely generous subscription to this site-- I am greatly honored by your support and readership. Thank you, Daniel B. ($10/mo), for your outrageously generous subscription to this site-- I am greatly honored by your support and readership.

Read more...

Tuesday, April 26, 2011

Gold As a Hedge: A Back-of-the-Envelope Calculation

How much gold would an individual investor need as a hedge against the total depreciation of fiat currencies? Here is a back-of-the-envelope calculation.


My view that gold is a prudent hedge is well-established in my archives. For example, from 2006: Gifts and Gold (December 9, 2006) (promoting the idea of giving gold as a gift):

Recently, another friend asked if I was a "gold bug." I said, no, I wasn't. But I did say I thought it prudent to own some actual physical gold and some mining stocks or a gold ETF, and maybe some silver if you follow that metal or consider gold and silver roughly equivalent. As shown here this week, all currencies are declining against gold. Nuff said.


Beneath the Surface, Part III: The Dow and Gold (November 29, 2006)

From approximately 1980 through 2002, the ratio of the Dow and gold moved in sync (i.e. was in correlation) with the Dow Jones Industrials. But since the market low in 2002, the two have radically diverged.


Now it is always possible that a historic correlation has been broken. But it behooves those of us trying not to lose whatever capital we might have in this world to consider an alternative: that the divergence will return to convergence.


(Discussion of how this could be achieved: either the dollar strengthens or gold rises.) The likelier possibility is a collapse in the dollar and a doubling of the price of gold.

At the time that was written, the gold/Dow ratio was 20--now it is 8.3 (Dow 12,500, gold $1,500). In other words, the divergence has only widened.


This raises an interesting question: how much gold would be needed as a prudent hedge against the total depreciation of fiat currencies? I recently conducted a back-of-the-envelope thought experiment on this topic in the Weekly Musings (for subscribers/major contributors).


Here is an outline of the thought experiment and calculations. Please note this is NOT A RECOMMENDATION TO BUY OR SELL ANYTHING, it is a thought experiment presented as "food for thought." Please read the HUGE GIANT BIG FAT DISCLAIMERbelow.


Starting point assumption: There is some probability (low or high is a matter of judgment) that as a result of the fundamental imbalances in the current global financial system, all fiat currencies will depreciate to near-zero. This is also referred to as hyperinflation or loss of faith in paper money.


A persuasive case can be made that this is not a probability but the inevitable end-game of the Status Quo: Deflation or Hyperinflation (FOFOA).


A 27-page analysis Apropos of Everything, Parts II & III reaches the same conclusion, while also making a strong case that the only functional, practical choice as a replacement for debased paper currencies is a gold-backed currency.


I have been persuaded of this since reading Gold: The Once and Future Money by Nathan Lewis, who has kindly corresponded with me on a variety of topics.


This book is an extremely readable history of money, gold and the politics of monetary policy as well as a carefully reasoned explanation of why gold-backed currencies provide stability. (Some argue that the 19th century booms and busts prove this wrong, but those booms and busts were credit-based. But I digress.)


I have also speculated here on the possibility that the private sector would lead the way to gold-backed currencies by establishing a non-State gold-backed "note."


Some readers have said that gold itself is money, but this isn't the point: the point is that trade over great distances requires a trusted medium of exchange, be it "commercial paper" or some other promissory note that can be exchanged to buy and sell real goods. This has been true since the rise of modern capitalism in the 1500s. (For more on this topic, please read this wonderful three-volume history of early Capitalism: The Structures of Everyday Life (Volume 1)
The Wheels of Commerce (Volume 2)
The Perspective of the World (Volume 3)


The point here is that there is a possibility that all fiat currencies will experience a loss of faith/rapid depreciation as the Status Quo devolves. Please read the above article links for more.


You don't have to judge this as likely to consider a hedge, you simply have to assess it as possible.


So how much gold would a household need to hedge their paper wealth against depreciation? In Apropos of Everything, Parts II & III Paul Brodsky reckoned that gold at $10,000 an ounce would enable the U.S. to back its current money supply with the 256 million ounces of gold it holds in reserve.


That is one rough approximation of how much gold one would need to hold to hedge paper financial assets. If gold were to rise 6.6-fold from $1,500 to $10,000, then $10,000 of gold at today's price (6.6 ounces in US dollars) would hedge $66,000 in paper financial capital.


In other words, after the dollar (and other paper currencies) fell into the black hole and disappeared over the event horizon, then the 6.6 ounces would be equal in purchasing power to the $66,000 in paper assets that just vanished.


I know there are many other complicating factors, but this is a rough calculation.


I reached a different conclusion by following the idea presented by Brodsky that gold-backed money would have to equal all the current paper money.


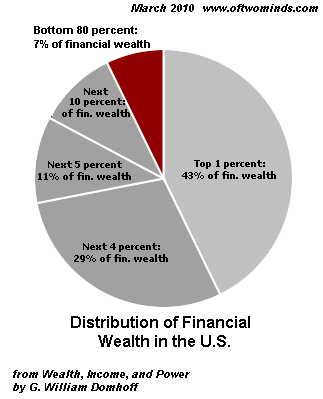
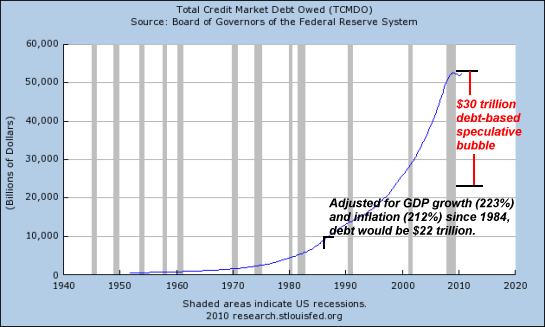
First, let's take all current financial net worth (assets minus liabilities) in the U.S. which according to the Fed Flow of Funds is about $35 trillion. (Net fixed assets such as real estate are about $10 trillion.)


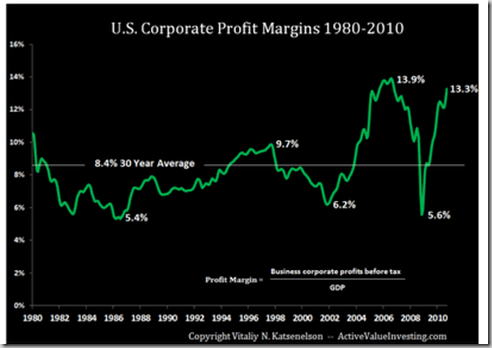
Total financial assets are $47 trillion, but these include corporate equities and non-corporate business assets which include factories, production facilities, etc. owned by the corporate and non-corporate enterprises. These tangible assets would still retain their utility value after the "event horizon" depreciation, so I don't think they should be included in purely paper financial assets such as stocks based on "blue sky," bonds based on future promises of payment, etc.


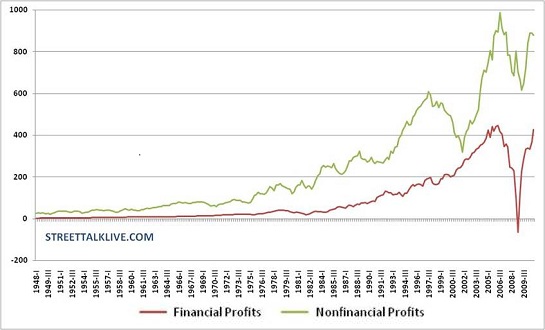
If you disagree, then take the $47 trillion number as a starting point. Or if you reckon corporate profits are an income stream that will retain value after a fiat currency depreciation, then feel free to adjust the financial assets down to whatever number you think approximates the financial wealth that would be lost in a stick/slip "black hole" currency depreciation.


The U.S. has about 25% of the world's wealth, so let's multiply the $35 trillion in purely financial capital by four: thus the global economy has about $140 trillion in purely financial wealth (pension funds' holdings of blue-sky stocks, bonds, etc.)


Once again, this is all back-of-the-envelope.


There are about 5.3 billion ounces of gold "above ground," roughly 160,000 tons. At the current price of $1,500 an ounce, all the available gold is worth about $8 trillion. About half is in jewelry, 10% in industrial uses and 40% as central bank reserves and investment.


If gold took the place of fiat currencies as "money," the available gold would have rise to about $140 trillion in value. In today's dollars, that's about 18 times its current price. So $1,500 X 18 = $27,000 an ounce.


Let's round that off to $25,000 an ounce. (Feel free to round it up to $30,000 if you prefer.) If you prefer to subtract industrial gold or other uses from the calculation, then the number will be much higher. I am presenting the idea as simply as possible.


To hedge $250,000 in paper financial wealth (recall that productive real estate, windmills, factories, etc. would still retain their productive utility value after currency depreciation), you would need 10 ounces of gold, or $15,000 worth at today's prices.


Though we cannot be sure of much in the world, we can be fairly certain that gold will not go to zero value. Thus owning gold is not like owning a futures contract which expires.


Let's say total fiat currency depreciation never occurs, and instead gold falls 50% in dollar-denominated value to $750/ounce. Many consider this very unlikely, just as others think a loss of faith in the dollar is a near-impossibility. Both are possibilities, regardless of the odds anyone places on them at any one moment in time.


Then the hedge against complete destruction of paper money would have cost $7,500, in "opportunity cost" if nothing else. That's a relatively modest price for $250,000 of "portfolio insurance" via a hedge that doesn't expire.


To complete the thought experiment: it doesn't really matter if the "new dollar" or quatloo are whatever is backed by gold or not; it might be a "hard currency" based on limited circulation, or some other scheme. The point is that if the present currencies suffer significant depreciation, then gold will reflect that.


In other words, if one "new dollar" replaces 20 devalued dollars, then gold will be worth 20 X $1,500 or $30,000 an ounce when the "new dollar" is imposed. Gold needn't be the "official money" at all to act as money.


Is now a good time to establish a gold hedge? I have no idea. I have no idea what will happen, tomorrow or next year or five years from now-- to the price of gold in dollars, to the value of dollars in other currencies, or anything else for that matter. Me only pawn in game of life. The thought experiment is an exploration of hedging, it is not a speculation on the future price of anything.


Please note this is NOT A RECOMMENDATION TO BUY OR SELL ANYTHING, it is a thought experiment presented as "food for thought." Please read the HUGE GIANT BIG FAT DISCLAIMER below.


HUGE GIANT BIG FAT DISCLAIMER: Nothing on this site should be construed as investment advice or guidance. It is not intended as investment advice or guidance, nor is it offered as such. It is solely the opinion of the writer, who is NOT an investment counselor/professional. All the content of this website is solely an expression of his personal interests and is posted as free-of-charge opinion and commentary. If you seek investment advice, consult a registered, qualified investment counselor (As with any other professional service, confirm their track record and referrals).


Readers forum: DailyJava.net.


Order Survival+: Structuring Prosperity for Yourself and the Nation (free bits) (Mobi ebook) (Kindle) or Survival+ The Primer (Kindle) or Weblogs & New Media: Marketing in Crisis (free bits) (Kindle) or from your local bookseller.

Of Two Minds Kindle edition: Of Two Minds blog-Kindle


Thank you, Pam & Pat ($25), for your long-standing generosity to this site-- I am greatly honored by your friendship, support and readership. Thank you, Jim L. ($50), for yet another outrageously generous contribution to this site-- I am greatly honored by your ongoing support and readership.

Read more...

Monday, April 25, 2011

Anatomy of a Crisis: 2011

What's behind the disturbance in the financial Force? QE, ZIRP, the dollar peg and inflation, to name a few factors.


There is a great disturbance in the world's financial Force. Many sense it as a storm on the horizon, something not yet visible but telegraphed by a rising, swirling wind and a new electric scent in the air.


I don't claim to have a complete narrative that accounts for all the points of friction wearing down the moving parts, nor do I claim a "solution." But a few observations might help inform our awareness of the disturbance.


As many of you know, readers provide most of the intelligence on this site ("of two minds, yours and mine"). I am the student and skeptic who learns from you and tries to make sense of a few dynamics, and extend them to some sort of coherent end-state. We share the same project of encouraging critical thinking.


1. There is a rising loss of faith in the conventional (i.e. propaganda) account of the U.S. economy. Readers tell me their local coin store has no silver coinage left, as the public has been buying with a vengeance. This is significant. (Silver has long been called "the poor man's gold.")


In the conventional view, the "herd" always gets it wrong: the "retail" "small speculator" investing public buy stocks and real estate at the top just as the "smart money" is distributing/selling. This "dumb money" cycle is certainly evident in manias and bubbles.


But there are also examples of "the public" acting well in advance (perhaps a form of "crowdsourcing") of the "experts."


One of the most remarkable trends of the past decade is the steady rise of the classic hedges against inflation and financial disorder: precious metals.


While the Federal government and a veritable army of conventional economists have repeatedly assured us over the past 10 years that the economy and the dollar are both sound, gold has quintupled from under $300 an ounce to over $1,500 an ounce.


Given that official inflation measured 26% for the decade 2001 - 2011, then clearly the public isn't "buying" the "sound dollar, sound economy" story.


They're also not buying the "you can't afford not to own stocks in the New Bull market" story: the public has sold some $350 billion of domestic mutual funds in the past two years.


These are unmistakable signs that the public has lost faith in the Federal Reserve's account of the dollar, U.S. stocks and the economy.


2. The idea that quantitative easing is benign has lost credibility. Even the MSM is reporting the dismal real-world results of QE2, for example, Stimulus by Fed Is Disappointing (understatement of the year?).


Another conventional view of QE--that it isn't "injecting liquidity" because it's simply an asset swap-- The end of QE and what it means for the market--misses the point, which is that boosting bank reserves (what QE accomplishes) enables additional leveraged 20-to-1 (or more) lending. QE also keeps U.S. interest rates near-zero, which encourages a carry-trade of dollars flowing around the globe seeking higher returns and offsets to global inflation, which is certainly higher than officially recognized. It’s this flow of cash that’s driving up commodity costs.


A T-Bill sits there earning interest but cash is mobile--it can go anywhere to seek a return. A T-bill cannot. So QE is not just some benign asset swap--it has the pernicious effect of feeding a vast risk trade in stocks, emerging markets and commodities.


If that flow of new cash ceases (QE ends), then the risk trade (and Treasury bonds) both lose a key support.


3. Much of the analysis of U.S. policy is narrowly U.S.-centric. The U.S. has often ignored the international consequence of its parochial concern with domestic politics. Indeed, the U.S. has dropped 5 million tons of bombs and killed 500,000 people (as well as cost its own citizens their lives) overseas in pursuit of domestic policy ("we can't 'afford' to lose Vietnam to the Commies because that would cost me the election.")


This blindness to the consequences of domestic policy is most striking when it comes to China.


The key dynamic is the linkage of the renminbi (yuan) and the U.S. dollar. When the dollar tanks, oil rises when priced in dollars--and thus it also rises when priced in yuan. Thus the decline of the dollar and the consequent rise in commodities has directly fueled inflation in China, which is more dependent on a per capita basis on materials than the U.S.


Yes, the yuan peg has declined from the 8.5 range down to 6.5 to the USD, but it is still firmly pegged. As the cost of materials priced in dollars soars, it feeds higher input costs in China.


China's policy-makers have exacerbated inflation by excessive money creation and lending by their own banks, but that alone is not sufficient cause for gasoline/petrol to cost as much in China as it does in the U.S. Oil is the foundation for petrochemicals, fertilizers, transport, plastics, etc., so the rise of oil driven by dollar depreciation is a driver of inflation throughout the Chinese economy.


No wonder the Chinese leadership is unhappy with the Fed's crush-the-dollar strategy.


Though the cost of soy beans imported from the U.S. remains fixed in terms of currency, the relentless rise in oil is also raising the cost of China's imports which are heavily dependent on oil, such as soy beans from the U.S.


4. China appears to be in the grip of a classic wage-price spiral inflation. Minimum wages are leaping by 25%, prices of many food items are doubling--this self-reinforcing dynamic is clearly visible in China. That is not the case in the U.S., which is being throttled by stagflation (rising prices and stagnant wages except for the top tier).


As I have noted before, price inflation in essentials hurts the lower income citizenry much harder than the top tier, as essentials make up a much larger percentage of the household expenses. A 30% jump in the cost of gasoline means little to a household in which gasoline accounts for 2% of total net income, but it certainly hurts a household in which gas accounts for 10% of total net income.


As noted in Your Pick, Ben, But One Goes Off the Cliff, the Fed's ZIRP and QE policies have pared future policy down to a stark fork in the road: end ZIRP and QE, and send the risk trade (stocks and commodities) off the cliff, or keep pushing the dollar down and the rising cost of oil will shove the U.S. economy over the cliff.


That would also feed inflation in China, which already threatens to destabilize its economy. Correspondents within China recall that rising inflation was an important (if conveniently forgotten) dynamic in the 1989 era of dissent and disruption. The heavy-handed repression of domestic dissent and foreign reporting is evidence that the leadership in China has a keen appreciation of the connection between instability and rampant inflation.


So why is the Fed carpet-bombing the global economy? To protect the domestic economy? That makes no sense, for the Fed's policies are pushing oil up to the point where there is no way to keep the U.S. economy from tipping into recession. It isn't acting on behalf of the domestic economy, of course; it's acting on behalf of domestic banking and Wall Street.


The Fed is busily destroying the village, suposedly to save it--only it's the global village. But the Fed isn't the only player with a stake in its game, and the other players, notably China, are tipping their hand that they will have to act, and soon, to protect their own domestic economies from the Fed's destructive policies.


Additional note: I have often asked how hyperinflation would benefit the Financial Elites;blogger FOFOA kindly offered a detailed answer.


Important reminder: all "investments" are speculations; the only difference is the time-frame (short, medium or long-term). One reader opined that I was a danger to my readers in describing a "Contrarian Trade" in the U.S. dollar ETF, UUP. Please note I highlight topics as "food for thought," not as investment recommendations. If anyone ignored my disclaimer and followed me into UUP, please set stops to exit the trade if the DXY (dollar index) breaks its 40-year support level around 71. It seems suicidal for the Fed to push the dollar down into uncharted territory where the risks of global destabilization increase enormously, but they may well do so. As individual investors, we assess the probabilities and make bets on what appear to be the most likely outcomes within whatever time-frame we are working. Lower probability events occur with great regularity, so we have to protect our capital if a trade goes south.


It wouldn't surprise me in the least to see the DXY dip to a new low just to sweep all the stops sitting there, and then stage a sharp rally in the short-term. But that is merely a guess, one possibility of many.


In addition to capital preservation, I am also very careful to follow Ed Seykota's trading rule to never risk more than you can afford to lose.


Readers forum: DailyJava.net.


Order Survival+: Structuring Prosperity for Yourself and the Nation (free bits) (Mobi ebook) (Kindle) or Survival+ The Primer (Kindle) or Weblogs & New Media: Marketing in Crisis (free bits) (Kindle) or from your local bookseller.

Of Two Minds Kindle edition: Of Two Minds blog-Kindle


Thank you, E.P.H. ($10), for your excellently generous contribution to this site (via mail)-- I am greatly honored by your support and readership. Thank you, Sherry B. ($25), for your wondrously generous contribution to this site-- I am greatly honored by your support and readership.

Read more...

Saturday, April 23, 2011

The Crash Course: The Book

The Crash Course is now available in book format.


Many of you are already familiar with Chris Martenson's "The Crash Course" video and website. Chris now has a book version which joins the small shelf of books I recommend as starting points for understanding our collective future: The Crash Course: The Unsustainable Future Of Our Economy, Energy, And Environment.


Those of you who have seen Chris lecture know he has a very down-to-earth, succinct, data-driven approach to explaining Peak Oil and Peak Everything, and he has brought these same characteristics to the book.


Anyone giving The Crash Course book as a gift this year is going to look very prescient come 2012.


I appreciate that Chris doesn't claim to have a crystal ball about the future (nobody has one); instead, he offers several plausible scenarios and frames a practical perspective that invites any level of participation: what Chris calls "step zero," the step before Step One.


I know Chris personally, and while that undoubtedly colors my assessment of the book, I don't think it the key factor in my recommendation. A job well done, Chris--thank you for putting the Crash Course into book form.


Like many of you, I have read dozens of books on peak oil, the financial mess, etc. etc., and while I have learned valuable things from all of them, I would recommend a handful as especially suitable for those to whom these concepts are new.


The general context of the future:


The Crash Course: The Unsustainable Future Of Our Economy, Energy, And Environment


The Long Emergency: Surviving the End of Oil, Climate Change, and Other Converging Catastrophes of the Twenty-First Century


Financial Armageddon: Protecting Your Future from Four Impending Catastrophes


The Long Descent: A User's Guide to the End of the Industrial Age


The Fourth Turning


The Great Wave: Price Revolutions and the Rhythm of History


The Future of Life


The nature of risk and markets:


The (Mis)behavior of Markets


The Great Crash 1929


The history and study of societal collapse:


The Upside of Down: Catastrophe, Creativity, and the Renewal of Civilization


The Collapse of Complex Societies


The Fall of the Roman Empire


History of capitalism and global trade:


The Structures of Everyday Life (Volume 1)


The Wheels of Commerce (Volume 2)


The Perspective of the World (Volume 3)


Alternatives to "wealth means owning my own private island and jet"


Early Retirement Extreme: A philosophical and practical guide to financial independence


Survival+: Structuring Prosperity for Yourself and the Nation


The latter is my own work, and if I had to characterize what it adds to the mix, I would hazard that it covers the consumerist mindset and speaks directly to the politics of our experience and the role of enterprise and localized political action going forward.


Please review my entire list of books and films if you haven't done so recently.


Readers forum: DailyJava.net.


Order Survival+: Structuring Prosperity for Yourself and the Nation (free bits) (Mobi ebook) (Kindle) or Survival+ The Primer (Kindle) or Weblogs & New Media: Marketing in Crisis (free bits) (Kindle) or from your local bookseller.

Of Two Minds Kindle edition: Of Two Minds blog-Kindle


Thank you, Thomas M. ($20), for your most generous contribution to this site-- I am greatly honored by your support and readership. Thank you, George B. ($5), for your much-appreciated generous contribution to this site-- I am greatly honored by your support and readership.

Read more...

Friday, April 22, 2011

Your Pick, Ben, But One Goes Off the Cliff

It's one or the other, Ben: you either push the real economy over the edge or you push stocks and the risk trade off the cliff.


Now that you've pushed the dollar down, Ben, it's your pick on what to push off the cliff: your beloved risk trade or the real economy. Here's a chart of the U.S. dollar and crude oil. Notice they're on a see-saw: when the dollar tanks, oil skyrockets. When the dollar recovers a bit, oil declines.


Ben Bernanke and the Fed are replaying their 2008 game plan: drive the dollar down to goose the risk trade in stocks. But a funny thing happened on the way to blowing another equity bubble: oil bubbled up, too, and that killed the real economy.


For the past three years, Ben has been trying to resuscitate the real economy via "the wealth effect": if your portfolio of stocks is rising, then you'll feel richer and your "animal spirits" of borrowing and spending will be aroused. The only proven way to goose stocks is to crush the dollar so overseas corporate earnings will be boosted by the currency depreciation (when transferred back into dollars, even flat profits look like they're rising), and U.S. exports will be cheaper to our trading partners.


Flooding the U.S. market with liquidity and keeping interest rates at zero had another consequence, one adamantly denied by the Ministry of Truth: it sparked a carry trade in which cheap dollars could be borrowed for next to nothing and exported around the world to seek higher returns.


Unsurprisingly, much of this free money flowed into commodities, which retained their value as the Fed pushed the dollar down. Also unsurprisingly, oil exporters raised the price of their oil in dollars as the dollar tanked.


Ben and his motley crew at the Fed reckoned that the financialized U.S. economy would respond positively to the lower dollar and the goosing of the risk trade in stocks. But the guys and gals seem to have forgotten that the real economy is dependent on oil. All the folks at the cocktail parties attended by Yellen et al. may be gushing over their hefty stock gains, but in the kitchen and carpark the workers are grousing about the rising prices of food and gasoline.


Now the cost of oil--the lifeblood of the real economy--is close to the point that it will push the real economy into recession. This sets up a difficult choice for Ben: if he pushes the dollar down to new lows, then oil leaps up and pushes the real economy off the cliff.


Alternatively, Ben renounces QE3 and "surprises" the markets with a rate increase, thus rescuing the dollar from freefall and pushing oil down. But that will send his precious risk trade and equity Bull off the cliff.


The politicos won't like either choice, but sacrificing the real economy will cost them their seat. All the fatcats who've raked in tens of billions from the risk trade Bull will be demanding that Ben "save" the financialized economy, but the politicos will see their political obituaries being written. Yes, the fatcats will shower them with millions in campaign contributions, but even those millions won't change the fact that Americans reliably vote their pocketbooks.


If rising oil pushes the real economy over the cliff, voters will not be re-electing incumbents in 2012.


Welcome to reality, Ben. Your "let's pretend the recovery is real" game is nearing an end. If you push the dollar down any more, then oil will go up and tip the real economy into a recession that QE3 will only make worse as you send the dollar into freefall. If the dollar rises, then your beloved "wealth effect" dies a horrible death on the rocks below.


Take your pick, but choose wisely.


Readers forum: DailyJava.net.


Order Survival+: Structuring Prosperity for Yourself and the Nation (free bits) (Mobi ebook) (Kindle) or Survival+ The Primer (Kindle) or Weblogs & New Media: Marketing in Crisis (free bits) (Kindle) or from your local bookseller.

Of Two Minds Kindle edition: Of Two Minds blog-Kindle


Thank you, Christine P. ($50), for your stupendously generous contribution to this site-- I am greatly honored by your support and readership. Thank you, Rick E. ($5/mo), for your splendidly generous subscription to this site-- I am greatly honored by your support and readership.

Read more...

Thursday, April 21, 2011

Our "Let's Pretend" Economy

There are two economies--the real one, which is in decline, and the "let's pretend" one touted by the State and corporate propaganda machines.


Children love to play "let's pretend." Let's pretend the economy is "recovering."Why does this "recovery" remind me of an addict who's conning his caseworker? (Yes, I'm really in recovery--those aren't tracks, they're insect bites....)


Let's play pretend that jobs are really really coming back, so please ignore this chart, or turn it upside down:


Also ignore that Big U.S. Firms Are Shifting Hiring Abroad.


Let's pretend that households, corporations and government are reducing their debt. To do that, we have to ignore that the debt-junkie (i.e. the U.S.A.) hasn't kicked the monkey off its back, it just keeps feeding it more debt. David Stockman dismantled all that propaganda about corporations sitting on trillions in cash--they're sitting on even bigger piles of debt: Federal Reserve’s path of destruction. He also takes out the claim that "consumers are deleveraging." Consumer debt has barely budged.


Never mind, let's pretend we're deleveraging. So please ignore this chart:


Excuse me but that cute little debt monkey on your back is actually an 800-pound gorilla.


Let's pretend that wages are rising. Except they aren't--household income is getting creamed. Real wages are back to the pre-dot-com bubble days of 1996--only the debt load on households and the nation have skyrocketed since then.


Courtesy of the always insightful Oil Empire and Peak Oil, here is a chart of the ratio of wages to gasoline:


Put another way: this is your wage priced in gasoline. Notice how wages tanked when oil hit $140/barrel in the summer of 2008, and how the brief plunge in oil around Q1 2009 caused a spike in the ratio. Now that the Fed is destroying the U.S. dollar, then oil is back over $100 and well on its way to $120 and higher.


Let's pretend your purchasing power isn't in a free-fall. Have you eaten an iPad recently? Yum, crunchy!


Let's pretend unemployment is falling. The only way to make losing 7 million jobs look good is to ignore this chart of the ratio of civilian employment to population. The ratio is back to the 1970 level, back before Mom, Sis and Aunty all went to work. This means there are fewer people working to support the population. Fewer workers means higher taxes on those still standing, and higher debt loads on them, too, as they have to service household debt, student loans, underwater mortgages and a Federal debt that's exploded higher by $1 trillion a year just since the "end of the recession."


Let's pretend corporate profits are the most important metric of our financial well-being.


Who benefits from the surge of corporate profits to record levels around $1.6 trillion, or 11% of GDP? The 21 million employees of global Corporate America certainly do, but then they represent about 16% of non-farm employment, roughly in line with government employment (22 million).


Too bad Global Corporate America is hiring where the growth is faster and the wages lower, i.e. overseas (Big U.S. Firms Are Shifting Hiring Abroad).


Let's pretend those great profits trickle down to the greater good. Only they don't. Corporate taxes (around $330 billion annually) cover less than 10% of Federal expenditures (Federal Budget 2009) and despite those record profits--surprise, Corporate Tax Receipts Plunge 31% in Q1.


The tax avoidance Panzer divisions of Global Corporate America are simply unstoppable forces of Nature, it seems. Corporate welfare queens never had it so good.


But let's pretend those profits increase the wealth of a broad spectrum of citizens.Oops, the top 5% of households collect 72% of the corporate profits.


In Who Rules America?, Sociologist G. William Dumhoff draws an important distinction between the net worth held by households in "marketable assets" such as homes and vehicles and "financial wealth." Homes and other tangible assets are, in Dumhoff's words, "not as readily converted into cash and are more valuable to their owners for use purposes than they are for resale."


Financial wealth such as stocks, bonds and other securities are liquid and therefore easily converted to cash; these assets are what Dumhoff describes as "non-home wealth" on his website Wealth, Income, and Power.


As of 2007, the bottom 80% of American households held a mere 7% of these financial assets, while the top 1% held 42.7% and the top 20% held fully 93%.


Never mind that, let's pretend the corporate profits trickle down via the "wealth effect" to pension funds that benefit workers everywhere. Too bad that according to the Fed flow of funds data, this rousing, raging Bull Market in stocks fueled by stupendous corporate profits has only brought total pension fund assets back to their 2007 level: $13.3 trillion in 2007 and $13.1 trillion in 2011.


Adjusted for inflation (as measured by the Bureau of Labor Statistics), the pension assets would have to be over $14.3 trillion just to stay even with their value in 2007. So pension funds have actually declined by over $1 trillion in real dollars in the Great Bull Wealth Effect.


So the wage earner's pension assets have actually fallen. We got your wealth effect right here, buddy, right next to the "recovery." And the check's in the mail, we promise.


How much longer are we willing to play "let's pretend"? Eventually we'll have to return to the grown-up world and deal with reality.


Readers forum: DailyJava.net.


Order Survival+: Structuring Prosperity for Yourself and the Nation (free bits) (Mobi ebook) (Kindle) or Survival+ The Primer (Kindle) or Weblogs & New Media: Marketing in Crisis (free bits) (Kindle) or from your local bookseller.

Of Two Minds Kindle edition: Of Two Minds blog-Kindle


Thank you, Scott B. ($75), for your immensely generous contribution to this site-- I am greatly honored by your support and readership. Thank you, James L. ($5), for your much-appreciated generous contribution to this site-- I am greatly honored by your support and readership.

Read more...

Wednesday, April 20, 2011

The Fundamental Injustice That Is Poisoning the Nation

The guilty are powerful and free, the innocent burdened and oppressed: that is injustice.


There is a fundamental injustice that is poisoning the soul of the nation, and if it is not openly addressed then the nation will face the explosive consequences of institutionalized injustice.


Simply put, it is this: those responsible for the nation's financial crisis and its catastrophic after-effects are not paying for the consequences of their actions--it is the innocent, those who were not responsible, who are paying the price.


You can call it whatever you want: the Anarchy of the Super-Rich (as per Paul Farrell), the Financial Power Elite, the financial Oligarchy, Plutocracy or Corporatocracy, or the unprecedented concentration of financial wealth and political power in a financialized post-industrial economy. Whatever you call it, we all know this class of financiers and its minions got away with high financial crimes.


Do the crime, do the time--unless it's "white-collar" financial crime on a vast scale. Then you might pay a wrist-slap fine (a few million dollars from your treasure of embezzled hundreds of millions) and then you're free to go on your merry way.


The after-effects are not just the losses which can be totalled on a calculator: the really catastrophic losses are to the foundations of democracy and the economy. Democracy has been subverted--oh please, spare us the happy-story propaganda about "reform" and "the system worked"--and the economy has been incentivized to favor poisonously addictive financialization and the shadow institutions of corruption, fraud, embezzlement, favoritism, collusion and misrepresentation of risk. This might be summarized as the protection of vested interests, engineered and overseen by the partnership of the ever more intrusive Central State and the nation's Financial Power Elite.


The Central State, designed to protect the citizenry from an oppressive monarchy or Elite, now protects this Elite from the citizenry. That is how thoroughly the injustice has been institutionalized.


There is a second part to this fundamental injustice: look who will pay for the bailouts, guarantees and the interest on the borrowed trillions. Not the banks and bankers, to be sure. Who will pay? Those who the Central State can easily tap: taxpayers who earn most of their income from wages, and those politically weak players dependent on government payments.


Now that the bills of the bailout are coming due, the State isn't going after GE for more taxes. Heavens no--if you try that, the Panzer Division of GE's tax avoidance army would overrun you. No, the politically easy thing to do is raise taxes on wage earners and trim entitlements, because all the government needs to do is send down the orders and it is done: the taxes are withheld and the bennies trimmed.


To go after the Power Elite is just too difficult. They have the tax attorneys, the lobbyists, the campaign fundraisers, and all the rest.


The U.S. is just a third world kleptocracy on an Imperial scale. I explored the parallels with the Roman Empire in Survival+: the Elites increasingly avoided military service and taxation, the bedrock of Roman power, while the taxes on the middle class rose to such heights that this productive class was basically driven into serfdom. The bottom layer of State dependents was placated and made complicit with bread and circuses--yes, Rome had a vast "welfare state" and much of Rome's population received free bread to keep them quiet and pliant.


That is of course a road to ruin: let the Elite plunder at will, protected by the Imperial Central State, tax the productive class to fund the armed forces and free bread, and then buy off the lower class with bread and circuses.


The only successful model of reconciliation and justice we have is the "truth commissions" in other post-oppression autocratic kleptocracies. In countries that were deeply divided and poisoned by institutionalized injustice and exploitation, the healing process requires a public, transparent "truth commission" in which the guilty are brought forth to confess their sins against the innocent and face the consequences of their actions.


If a society cannot rouse itself to cleanse the fundamental injustice at the heart of its institutions, then it is effectively choosing self-destruction.


So far, the U.S. is pursuing the Roman Imperial model with an institutional zeal unmatched since Rome's fall.


Embedded institutional injustice has a price, a price which rises with every passing day of propaganda and prevarication. Some day the bill will come due and a terrible price paid in full. For those in power, the only concern is that it not be today or tomorrow.


Readers forum: DailyJava.net.


Order Survival+: Structuring Prosperity for Yourself and the Nation (free bits) (Mobi ebook) (Kindle) or Survival+ The Primer (Kindle) or Weblogs & New Media: Marketing in Crisis (free bits) (Kindle) or from your local bookseller.

Of Two Minds Kindle edition: Of Two Minds blog-Kindle


Thank you, Ad N. ($50), for your outstandingly generous contribution to this site-- I am greatly honored by your support and readership. Thank you, Maynard W. ($5), for your most generous contribution to this site-- I am greatly honored by your support and readership.

Read more...

Tuesday, April 19, 2011

What's Hated Most May Be a Contrarian Buy (U.S. Dollar)

What's the obvious contrarian trade? Long the U.S. dollar.


I've been discussing the U.S. dollar since January (Could the U.S. Dollar Rise 50%?January 12, 2011), based on a simple trading observation: it's the most despised investment on the planet. Warren Buffett famously said "Try to be fearful when others are greedy and greedy when others are fearful."


This is a classic description of contrarianism: that the way to reap big profits is to do the opposite of the herd. By what metric do we measure extremes of greed and fear?


There are various technical tools like the VIX "fear index," but if there were a perfect measure then everybody would be using it, and then of course it would lose its edge.


Another way of saying the same thing is to buy what's completely hated and sell what's over-loved.


At this juncture that would suggest selling AAPL (Apple) and buying the U.S. dollar, which is almost universally expected to go to zero. Let's stipulate that barring drastic political changes which are unlikely, the case for eventual devaluation or destruction of purchasing power via inflation is strong. As Jesse at the always excellent Jesse's Cafe Americain recently noted, the question is when.


Another way of stating this same trade is gold is destined for $3,000/ounce and oil is inevitably on its way to $300/barrel. The reasoning behind such projections are sound: as the dollar loses purchasing power, then gold and oil will rise when priced in dollars.


These kinds of projections are mirrored by some wild claims for stocks: that Apple will be the first $1,000/share stock, that the Dow is heading for 36,000, and so on. The question is: what sort of conditions will be present when all this happens? If it takes $1,000 to buy a loaf of bread, then $1,000 for a share of Apple stock might well be cheap.


As I have noted before, there really is only one trade in the global markets: the U.S. dollar on one side and everything else on the other. Stocks, the euro, the yuan, real estate, precious metals, commodities, bat guano, quatloos, you name it, they're all trading in tight correlation against the dollar.


The ubiquity and virulence of anti-dollar sentiment reminds me of the sentiment toward gold in 2000. Gold had underperformed for 18 years, while stocks had made dizzying gains in that same time span. Buying gold in 2000 was for the deranged or sadly deluded. Looking back, selling stocks and buying gold at $300 an ounce in January 2000 was a very low-risk and profitable investment.


When sentiment is extreme, then that can be taken as a contrarian signal. Nothing is more hated and loathed than the U.S. dollar, which is widely perceived as on a one-way slide to Doom. If we stipulate this is a high-probability endgame, the question for those trying not to lose purchasing power is: when will it go to zero, and under what conditions?


My point here is simple: only rarely does consensus line up so powerfully behind one meme. It is accepted without debate that the dollar is going to zero, and those who state this as being as obvious as gravity (Marc Faber, for example) do grant that it can rise temporarily as a trade.


As a trader, I don't see much payoff to betting the dollar is doomed if the endgame is 10 years out, or even 5 years out. A lot can happen in 5 years.


This is why I have bought UUP, an ETF that goes up when the USD goes up. (This is disclosure, not a recommendation; please read the HUGE GIANT BIG FAT DISCLAIMER below.)


One reason I am seeking contrarian trades is the present zeitgeist reminds me of very strongly of mid-2007, when the global financial situation was obviously precarious, yet stocks remained at elevated levels for another year before imploding. I rather doubt the Status Quo can extend and pretend for another year, as it has already taken unprecedented gambles for the game to continue the past three years. But maybe they can play the thing out another year; the more energy and money it takes to keep the Status Quo afloat, the more strain is being placed on the system.


Bubbles take a while to pop, and the length of time they continue inflating often defies reason. In 1999 the voices of reason said the stock market bubble was already dangerously inflated, yet it continued inflating for another year. When will the current global bubble pop? That is unknowable, but the clock is definitely ticking.


As a trader, I see one trade: the dollar vs. everything else. That means if everything else tanks, then the dollar will rise. As a trader, I don't really care about the fundamentals of this possibility, or the complex reasons why it's "impossible." All sorts of "impossible" things happen, often very perversely when everyone seems to believe they are impossible.


Courtesy of Jesse, here is a long-term chart of the dollar (USD) as measured by the DXY index.


Here is a chart I published last week, courtesy of Harun I: The Fed's Most Dangerous Game: Checkmate (April 11, 2011)


Other observers are also seeing signs that a reversal is likely in the USD, for instance, the always insightful dshort.com: dollar due for a bounce?


I've marked up a chart of the DXY with some observations. As you can see, there is an upside target of 88, which represents a 17% gain from today's price. That's not great, but if everything else tanks, 17% might look bountiful to those who can't play the short side and must be long something.


Notice the pattern of the past few years: the dollar declines for 9-10 months and then rebounds for 6 or 7 months. Interestingly, that suggests the dollar might rise until late September or October, and then reverse in November, a seasonably positive turning point for stocks.


It's not very complex, but being long the dollar until October and then switching over to play a rebound in stocks looks like a potential trade. This is only the freely offered rambling of an amateur observer, of course; do your own analysis and make your own decisions.


Readers forum: DailyJava.net.


Order Survival+: Structuring Prosperity for Yourself and the Nation (free bits) (Mobi ebook) (Kindle) or Survival+ The Primer (Kindle) or Weblogs & New Media: Marketing in Crisis (free bits) (Kindle) or from your local bookseller.

Of Two Minds Kindle edition: Of Two Minds blog-Kindle


HUGE GIANT BIG FAT DISCLAIMER: Nothing on this site should be construed as investment advice or guidance. It is not intended as investment advice or guidance, nor is it offered as such. It is solely the opinion of the writer, who is NOT an investment counselor/professional. All the content of this website is solely an expression of his personal interests and is posted as free-of-charge opinion and commentary. If you seek investment advice, consult a registered, qualified investment counselor (As with any other professional service, confirm their track record and referrals).


Thank you, James M. ($20), for yet another magnificiently generous contribution to this site-- I am greatly honored by your support and readership. Thank you, Helen S.C. ($8), for another of your many oustandingly generous contributions to this site-- I am greatly honored by your support and readership.

Read more...

Terms of Service

All content on this blog is provided by Trewe LLC for informational purposes only. The owner of this blog makes no representations as to the accuracy or completeness of any information on this site or found by following any link on this site. The owner will not be liable for any errors or omissions in this information nor for the availability of this information. The owner will not be liable for any losses, injuries, or damages from the display or use of this information. These terms and conditions of use are subject to change at anytime and without notice.


Our Privacy Policy:


Correspondents' email is strictly confidential. This site does not collect digital data from visitors or distribute cookies. Advertisements served by a third-party advertising network (Investing Channel) may use cookies or collect information from visitors for the purpose of Interest-Based Advertising; if you wish to opt out of Interest-Based Advertising, please go to Opt out of interest-based advertising (The Network Advertising Initiative). If you have other privacy concerns relating to advertisements, please contact advertisers directly. Websites and blog links on the site's blog roll are posted at my discretion.


PRIVACY NOTICE FOR EEA INDIVIDUALS


This section covers disclosures on the General Data Protection Regulation (GDPR) for users residing within EEA only. GDPR replaces the existing Directive 95/46/ec, and aims at harmonizing data protection laws in the EU that are fit for purpose in the digital age. The primary objective of the GDPR is to give citizens back control of their personal data. Please follow the link below to access InvestingChannel’s General Data Protection Notice. https://stg.media.investingchannel.com/gdpr-notice/


Notice of Compliance with The California Consumer Protection Act
This site does not collect digital data from visitors or distribute cookies. Advertisements served by a third-party advertising network (Investing Channel) may use cookies or collect information from visitors for the purpose of Interest-Based Advertising. If you do not want any personal information that may be collected by third-party advertising to be sold, please follow the instructions on this page: Limit the Use of My Sensitive Personal Information.


Regarding Cookies:


This site does not collect digital data from visitors or distribute cookies. Advertisements served by third-party advertising networks such as Investing Channel may use cookies or collect information from visitors for the purpose of Interest-Based Advertising; if you wish to opt out of Interest-Based Advertising, please go to Opt out of interest-based advertising (The Network Advertising Initiative) If you have other privacy concerns relating to advertisements, please contact advertisers directly.


Our Commission Policy:

As an Amazon Associate I earn from qualifying purchases. I also earn a commission on purchases of precious metals via BullionVault. I receive no fees or compensation for any other non-advertising links or content posted on my site.

  © Blogger templates Newspaper III by Ourblogtemplates.com 2008

Back to TOP