


If Everything Is So Great, How Come I’m Not Doing So Great?
While the view might be great from the top of the wealth/income pyramid, it takes a special kind of self-serving myopia to ignore the reality that the bottom 95% are not doing so well.
We're ceaselessly told/sold that the U.S. economy is doing phenomenally well in our current slow-growth world -- generating record corporate profits, record highs in the S&P 500 stock index, and historically low unemployment (4.9% in July 2016).
While GDP growth is somewhat lackluster by historical standards—less than 2% in 2016—it's growth nonetheless. And the rate of consumer-price inflation is hovering around 1%; negligible by historical standards.
But this uniformly positive statistical view of the U.S. economy raises a question among those not in the top 0.1%: If everything’s going so great, how come I’m not?
Whether it's struggling to keep up with the rising cost of living, a 0% return on savings, working longer hours while real wages stagnate, scrimping to pay back education loans, despairing at the abuses of power in our banking and political systems, or lamenting the loss of nourishing social interaction in our increasingly isolated and digital lifestyle — most "regular" people find their own personal experiences to be at odds with the rosy "Everything is awesome!" narrative trumpeted by our media.
The Scorecard
To get a more concrete understanding of this gap, let's establish a scorecard we can individually fill in to make an assessment of just how well we’re doing.
The key point about such a scorecard is this: We can only optimize what we measure. If we don’t measure (for example) leisure time and well-being in our assessment ofAre we doing better than we were 10 years ago? then those issues simply aren’t considered.
And this is the flaw in using broad, easily-fudged statistics such as the unemployment rate as the primary measures of how great we’re doing (or not). What actually matters in life—our experiences, our stress level, our leisure time, our well-being and our sense of security, to name a few—is completely ignored by statistics such as GDP and unemployment.
I propose that a more accurate assessment requires responding to this list: Are you better off than you were 10 years ago in 2007, and 16 years ago in 2000?
1. Has the purchasing power of my earnings increased or declined since 2007 and 2000? That is, do my monthly earnings buy more healthcare insurance, college tuition, shelter and other goods and services than they did 10 and 16 years ago?
Here are a few charts to help you answer accurately:


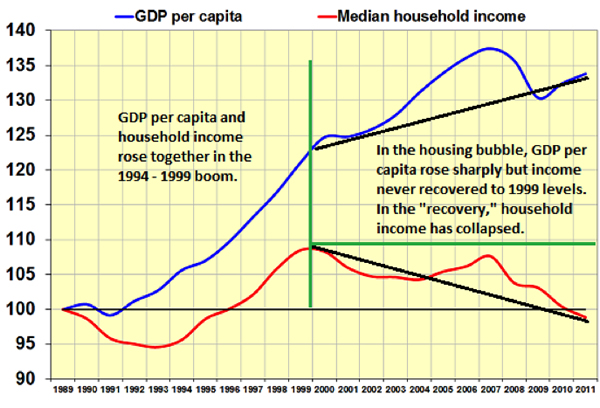
These charts make it clear that real income (i.e. purchasing power) has declined markedly while big-ticket costs such as healthcare have skyrocketed for the majority of American households.
2. Is the quantity of packaged goods you buy now the same or less than in 2007 and 2000? That is, does the package that once contained 16 ounces now contain 14 ounces or even less?
3.Has the quality of goods and services you purchase now better or worse than the quality you received for the same share of your earnings 10 and 16 years ago? Do appliances last as long as they did then, or do they last longer? Do electronic devices last longer than they did in the past? How about furniture, clothing, etc.?
4. Does your children’s education better prepare them for a fast-changing economy now compared to 10/16 years ago?
5. How much shadow-work (to use Catherine Austin Fitts’ apt phrase) do you have to do now compared to 10/16 years ago? By shadow-work we mean work that was once done by businesses or the government that you must now perform yourself: pump your own gas, etc.
6. How much time do you now spend trying to fix administrative errors and things that are broken: incorrect billing, computer patches that don’t fix the problem, etc.?
7. Is your overall health and well-being better than it was 10/16 years ago, or worse? (Of course we have to allow for the advance of age, but the question is about how you feel and whether you now must deal with chronic diseases, pain management, etc. that you didn’t have 10 years ago.)
8. Is the quality of your healthcare better or worse than 10/16 years ago, in terms of cost, waiting time, co-pays, accuracy of diagnoses, ability to book an appointment in the near future, etc.?
9. Is your local infrastructure better or worse than it was 10/16 years ago? Are the roads better maintained, the trains and buses cleaner, the service personnel friendlier and more helpful?
10. Are your local government services more or less costly than they were 10/16 years? Have fees for water utilities, garbage pickup, license renewals, parking tickets, etc. gone up about 1% or 2% annually, in line with official inflation, or have they leaped by 5% or more year after year?
11. Are you receiving more government services for your increased property taxes? If so, precisely what services have been improved/added as a result of your paying higher property taxes?
12. Do you feel the safety and security of your neighborhood has increased or decreased? Do you safer walking home at midnight or less safe compared to 10/16 years ago?
13. Have the odds of a secure retirement with an income that will easily keep up with real-world inflation (around 7% annually) increased or decreased compared to 2007/2000?
14. Has your income on retirement money—IRAs, etc.--in bonds and savings accounts risen or declined?

15. Do you have more leisure time or less leisure time than 10/16 years ago? (Subtract the time spent on social media.)
16. Do you have more vacation time, and more money set aside to actually take a vacation with your family compared to 10/16 years ago?
17. Are you sleeping more or less than 10/16 years ago? (Sleep is a good indicator of health—poor sleep is highly correlated with poor health and chronic diseases.)
18. If you liquidated your stock holdings and retirement funds invested in stocks, are you wealthier (adjusted for inflation) than you were in 2000 and 2007?
19. Have you been able to save more annually now than you could 10/16 years ago?
20. Has your household debt load (student loans, mortgages, vehicle loans, consumer debt, etc.) increased or decreased since 2000 and 2007?
21. If your equity in real estate, stocks and bonds has increased, what (if any) improvements to the household did you fund with this “wealth effect”?
22. In terms of income, equity and exposure to risk, are you more financially secure or less financially secure than 10/16 years ago?
23. If you are more secure financially, how much of this financially security is the result of family gifts or an inheritance? How much is the result of higher real earnings? How much is the result of rising equity in real estate, stocks and bonds?
24. Do you feel more or less stress due to overwork, time pressure, financial worries, etc. compared to 10/16 years ago?
25. Are the people you associate with—colleagues, friends, neighbors, extended family members—experiencing higher levels of stress due to health crises, financial insecurity, overwork, etc., or are they generally experiencing less stress and chronic anxiety?
26. Do you have more time and money to invest in self-care (enrichment classes, concerts, fitness, hobbies etc.) or less time/more time for free-ranging, leisurely conversations with friends?
27. Is housing more affordable (to rent or buy) or less affordable than it was in 2007 and 2000?
28. Do you have more close friends or fewer close friends than you did 10/16 years ago? (A close friend is defined as someone who is always welcome to sleep in your guest room or on your sofa, someone with whom you can speak openly and truthfully about difficult emotional/financial issues.)
29. Do you feel your prospects—for greater financial security, higher earnings, career advancements, personal well-being, health, fitness and ability to help family and friends—are better or worse compared to 2000 and 2007?
30. Do you feel the prospects of your children and grandchildren are brighter or dimmer compared to 2007 and 2000?
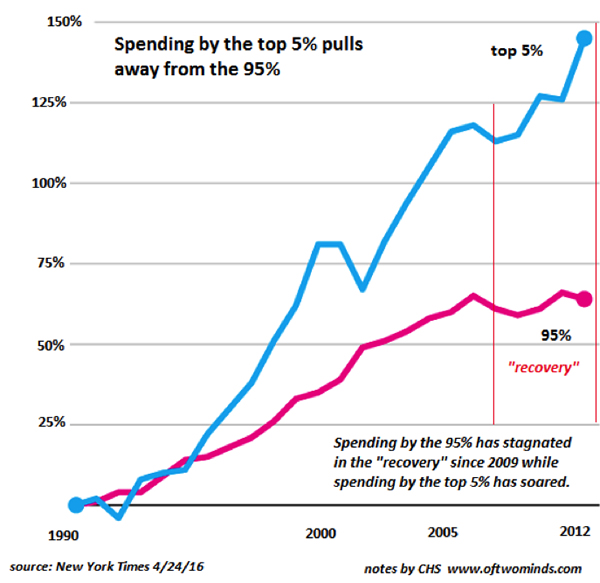
If you're healthier, wealthier, more secure, have more leisure, more disposable income, less debt, a wider circle of intimate friends and are confident the future holds better prospects than it did 10/16 years ago, then — Congratulations!—you're doing great. And if you're still in the work force, you’re in the top 5% of American households:

Alternatively, if you’re retired with multiple ample pensions and/or you sold the modest home you bought decades ago for $100,000 for $1,000,000 or more, and you live in an upscale neighborhood, then you very likely feel that life is good and the future is bright.
This sort of security puts you in the top 10% of the nation’s households.
If you paid off the mortgage, have decent healthcare insurance and live in a place where services are available and affordable and you have a secure income, then you probably feel things are going well, too. This puts you in the top 20%.
But as many of you know from personal experience, a great many people who appear to “have it all” are struggling with financial crises, health crises, chronic stress due to financial insecurity, etc.
Some relatively modest percentage of American households are doing great—the thin slice that owns most of the nation’s wealth and thus has benefited from rising real estate, stock and bond prices. Another modest slice is doing well because they have secure positions in academia or the government, or if retired, draw ample pensions and healthcare benefits and have paid off their mortgage. A tiny slice has become multi-millionaires in the latest tech boom.
While the view might be great from the top of the wealth/income pyramid, it takes a special kind of self-serving myopia to ignore the reality that the bottom 95% are not doing so well.
In Part 2: The Keys To Prosperity, we provide guidance on strategies for how those 80-95% of us can position our efforts, our capital, and our mindsets in order to make the major macro trends in play work to our favor, and secure a prosperous future.
Click here to read Part 2 of this report (free executive summary, enrollment required for full access)
My new book is #7 on Kindle short reads -> politics and social science: Why Our Status Quo Failed and Is Beyond Reform ($3.95 Kindle ebook, $8.95 print edition) For more, please visit the book's website.
NOTE: Contributions/subscriptions are acknowledged in the order received. Your name and email remain confidential and will not be given to any other individual, company or agency.
Thank you, Jay S. ($5/month), for your supremely generous subscription to this site-- I am greatly honored by your support and readership.
|