


Three Charts That Blow the Doors Off any Hope of a 2012 Rally
The centrally-managed rally of March 2009 is over; reality is finally intruding on the manipulation and propaganda.
A good way to generate hate mail is to question 1) Santa's "guaranteed year-end rally" and 2) the notion that market rallies always resume soon enough because of the Federal Reserve's backstop/intervention.
If we step back from the latest shuck-and-jive data from the Ministry of Propaganda, a.k.a. the Status Quo managing perceptions, and take a longer view of the economy, money, credit and the stock market, we get an extremely troubling set of insights.
Courtesy of this site's Chartist Friend from Pittsburgh, here are three charts that completely undermine the fantasy that central planning/intervention can "save the market" once again in 2012 and beyond.
The first chart depicts annual percentage of change of Total Credit Market Debt and GDP. The black line tracks the annual percentage expansion of debt and the purple line shows the annual percentage of change in the Gross Domestic Product.
The second chart shows the velocity of M2 Money Supply and the S&P 500 (SPX) stock market index divided by the PPI (Producer Price Index). Velocity of money can be illustrated with a simple example: if the Federal Reserve creates a dollar out of thin air and a bank parks that digital dollar in its reserves, the velocity of that money is very low. If that dollar is lent out and spent at a business that then uses it to buy goods and services at another business where it is paid out as a wage that is spent, and so on, then the velocity of that money is high.
Dividing the SPX by the PPI is a way of adjusting for base inflation. This gives us a more accurate snapshot of reality than a nominal or unadjusted number.
The third chart presents the MZM (money zero maturity) Money Stock, a measure of supply of financial assets, and the 3-month T-Bill (Treasury bond) which reflects interest rates.
Here is our Chartist Friend from Pittsburgh's summary of the charts' fundamental meaning:
I think these three charts together do a good job of showing the correlation between the dynamics of money/credit and the real economy as measured by GDP, stock prices and interest rates. They paint a very clear picture: the economic contractions that we are experiencing today began roughly twenty years ago, and soon a full blown deflationary depression will be delivered.
Thank you, CFFP for sharing these excellent charts. I am adding a bit of commentary after each chart.
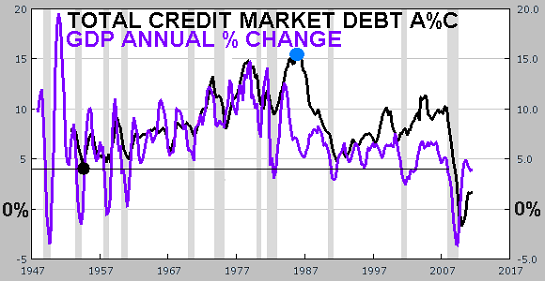
Note that GDP more or less tracked credit expansion until around 1979, often exceeding debt as the expansion of credit sparked real growth via investment in productive assets. In the inflationary 1970s, both credit and GDP rose. In 1986-87, credit exploded, leaving the real economy in the dust. From 1991 on, credit tended to expand at a much higher rate than the real economy, a trend that accelerated in the 2003-07 housing/credit bubble. This reflects the saturation or exhaustion of debt as a driver of growth, i.e. mis-investment in unproductive assets such as McMansions in the middle of nowhere.
Since 2009, GDP hasn't recovered to ite previous annual rates of change, and credit fell to a negative number, i.e. credit contraction, for the first time in the postwar era. It has since regained positive territory but the expansion is weak; simply put, people either don't want to borrow more or they can't borrow more.
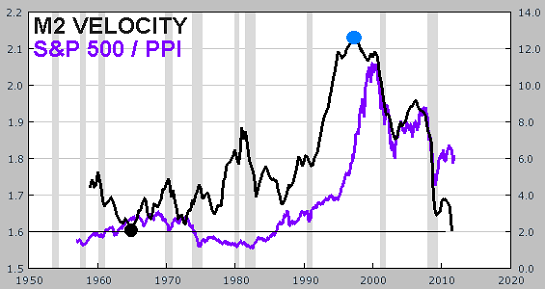
The velocity of money rose in the stagflationary 1970s, even as stocks yielded negative returns when adjusted for inflation, i.e. to real returns. Velocity declined in the mid-1980s and then exploded higher in 1990s, topping out several years before the stock market topped in 2000.
Velocity and stocks were highly correlated from 2000 to 2009, when the market staged a sharp rebound even as velocity continued down to a historic low. This suggests stocks have some catching up to do with velocity, that is, the S&P 500 should decline significantly.
Many people have noted the explosive rise in money supply (not shown) since the 2008 financial crisis; this chart shows that this "new money" isn't entering the real economy at all, as money velocity has plummeted to zero.
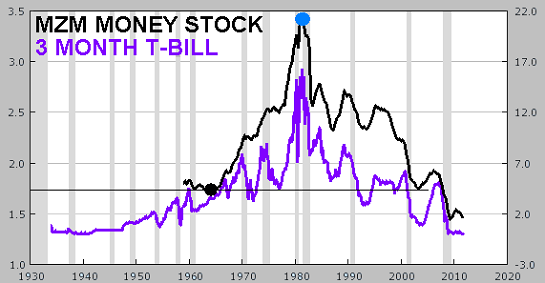
This third chart shows a rough but long-term correlation between T-Bill yields (interest rates) and the supply of financial assets (money stock). The stock of money fell off a cliff in 2000, and that marked the highs in both the S&P 500 and the T-Bill yield.
Maybe near-zero interest rates aren't the panacea the Federal Reserve thinks they are.
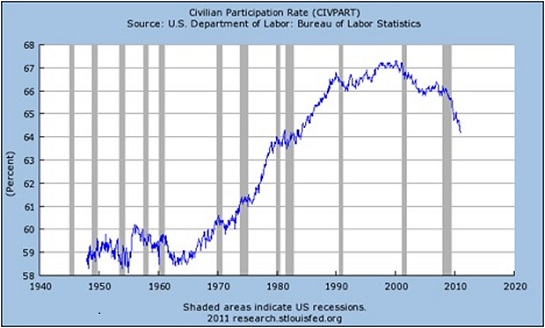
If we look at civilian participation in the workforce and other basic measures of employment, we find they topped out in 2000 as well.
If there is any evidence of a resurgence in the real economy just ahead, it isn't present in these charts. Any stock market rally in 2012 will not reflect the real economy, credit, money stock and velocity or employment visible in these charts. Until these charts shows positive fundamental improvement, a rally can only be smoke and mirrors, a trick of central planning manipulation that is unlikely to last longer than a sugar high.

If you're giving "store-bought" gifts this year:
And your gift-giving philosophy favors 1) everyday utility 2) durability/high quality 3) cost between $5 and $23, and 4) made in U.S.A. then this is the list for you: Favorite Practical Kitchen Tools (All Under $23, many under $10, most made in U.S.A.)
If this recession strikes you as different from previous downturns, you might be interested in my new book An Unconventional Guide to Investing in Troubled Times (print edition) or Kindle ebook format. You can read the ebook on any computer, smart phone, iPad, etc.Click here for links to Kindle apps and Chapter One. The solution in one word: Localism.
My Big Island Girl(fun, free MP3 song)
Readers forum:DailyJava.net.
Order Survival+: Structuring Prosperity for Yourself and the Nation (free bits) (Kindle) orSurvival+ The Primer (Kindle) or Weblogs & New Media: Marketing in Crisis (free bits)(Kindle) or from your local bookseller.
My Big Island Girl(fun, free MP3 song)
Readers forum:DailyJava.net.
Order Survival+: Structuring Prosperity for Yourself and the Nation (free bits) (Kindle) orSurvival+ The Primer (Kindle) or Weblogs & New Media: Marketing in Crisis (free bits)(Kindle) or from your local bookseller.
Of Two Minds Kindle edition: Of Two Minds blog-Kindle
| Thank you, David R. ($10), for your much-appreciated generous contribution to this site -- I am greatly honored by your support and readership. | Thank you, Loren F. ($50), for your splendidly generous contribution to this site -- I am greatly honored by your support and readership. |