


Is There Any Correlation Between the U.S. Dollar and Gold (Or Anything Else?)
If the U.S. dollar is in effect a non-linear entity, any linear correlations are likely to be wrong. As for gold--it appears to march to an independent drummer.
Whenever I make the case for a stronger U.S. dollar (USD), the feedback can be sorted into three basic reasons why the dollar will continue declining in value:
- The USD may gain relative to other currencies, but since all fiat currencies are declining against gold, it doesn’t mean that the USD is actually gaining value; in fact, all paper money is losing value.
- When the global financial system finally crashes, won’t that include the dollar?
- The Federal Reserve is “printing” (creating) money, and that will continue eroding the purchasing power of the USD. Lowering interest rates to zero has dropped the yield paid on Treasury bonds, which also weakens the dollar.
The general notion here is that, given the root causes of our economic distemper – rampant financialization, over-leverage and over-indebtedness, a politically dominant parasitic banking sector, an aging population, overpromised entitlements, a financial business model based on fraud, Federal Reserve monetizing of debt, and a dysfunctional political system, to mention only the top of the list – how can the USD appreciate in real terms?
All of these objections are well-grounded. Let’s look at some charts to discern what factors are “pricing” the dollar, domestically and internationally.
Before we start, though, let’s spend a few moments thinking through what a declining dollar means in the real world. Since the USD is the world’s reserve currency, we have to ask the question in two contexts: the domestic economy and the global economy. The Triffin Paradox explains why the domestic monetary policy of the nation that issues the reserve currency will conflict with the needs of the international community using the currency for reserves.
Let’s say that thanks to a depreciating dollar (what many call “inflation”), gasoline that once cost 40 cents a gallon now costs $4 a gallon. Back when gasoline cost 40 cents a gallon, the average wage was $1.60, so an hour of labor could buy four gallons of gasoline.
This ten-fold rise in the cost of fuel would certainly be catastrophic if earnings didn’t rise as well. But if earnings rose to $16 per hour, then an hour’s labor would still buy four gallons of gasoline. If gasoline rose to $4,000 a gallon, if earnings per hour also climbed to $16,000 per hour, then the purchasing power of an hour’s labor would remain constant.
If wages rose such that an hour’s labor bought five gallons of gasoline, the wage earner’s purchasing power has actually increased despite the apparent 90% drop in the value of the currency.
This suggests that a depreciating currency is not a domestic catastrophe unless earnings (and assets) do not rise in lockstep with the price of goods and services.
In terms of the international community, a depreciating dollar means oil exporters paid with dollars (so-called "petro-dollars") will have to raise the price of oil to offset the depreciation, and this could wreak havoc on other nations importing oil. In other words, the U.S. “exports inflation” by depreciating its currency, which is precisely what happened in China: Inflation leaped in China while it remained placid in the U.S. (at least by official calculations).
No wonder understanding the dollar’s value is so complex; it plays a duel role as the reserve currency and the U.S. currency, and it is influenced by a large number of domestic and international forces.
Charting the Dollar and the Metrics That Influence Its Value
Let’s start with two charts showing the dollar’s massive decline in domestic value over the past century and half-century.

From the long view, the USD had already lost 30% even before the Federal Reserve was founded. The much-discussed end of the gold standard (when the USD was no longer backed by gold) in 1971 had little effect.
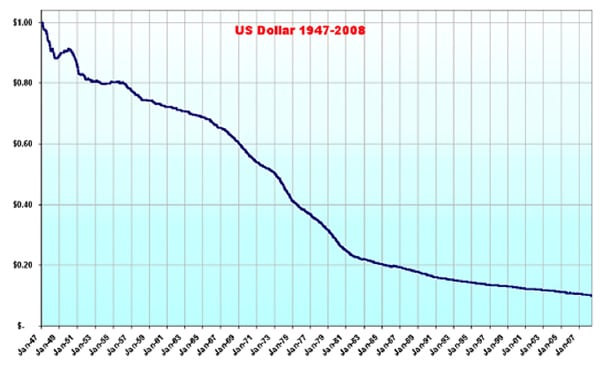
Here is the dollar from 1947 to 2008. In 1970, it was worth $0.60, and it has since slumped to $0.10 in constant 1947 dollars. This is confirmed by the BLS inflation calculator, which equates $1 in 1970 with $6 in 2012 dollars.
That is a nasty decline in 42 years, to be sure. Now let’s look at gross domestic product, earnings, and the size of the population and workforce.
According to the Census Bureau, the population of the U.S. was 203 million in 1970, and it is now 307 million, a roughly 50% increase.
The number of workers has risen 75%, from 80 million in 1970 to 140 million today.

If productivity remained constant, we might expect that gross domestic product would rise by 75% due to a larger workforce and the six-fold increase due to depreciation of the dollar. Since GDP was $1.038 trillion in 1970, we could expect $1T X 1.75 = $1.75T X 6 = $10.5 trillion. Actual GDP is over $15 trillion, a 50% increase over the adjusted-for-workforce-inflation result.

Here is the adjusted (real) GDP:

Adjusted for inflation/dollar depreciation, the GDP has tripled since 1970. Even if we discount half of this as official under-reporting of inflation, that is still a significant increase.
Next, let’s look at the critical metric of employee compensation. Did earnings rise along with prices?

It appears that earnings rose almost fourteen-fold while costs rose six-fold. Thus “real” earnings increased despite the depreciating dollar. Here is a chart of real household income, courtesy of DShort.com.

Here we see income disparity at work. Lower-income workers saw their real (adjusted) earnings rise by about 20%, middle-class employees registered gains of around 40%, while the top 20% realized gains of about 70%. The top 5% has seen real income almost double. Note that the income in all brackets has declined or stagnated since 2000.
Now let’s look at some other basic measures of economic activity: corporate earnings and government spending.

Corporate profits have zoomed over thirty-fold since 1970, while Federal spending has increased about eighteen-fold.

Federal tax receipts have increased about twelve-fold.

What does all this mean? It appears that a steadily depreciating dollar did not harm the nation’s output, earnings, corporate profits or government spending. Though rising income disparity is troubling, it cannot be traced to the depreciating dollar.
Next, let’s look at the three factors most often mentioned as setting the value of the dollar internationally: interest rates, the monetary base, and gold.
Interest rates, measured here by the yield on the ten-year Treasury, topped at 16% in 1982.

If interest rates drive the value of currencies, we would expect to see the dollar rise and decline along with interest rates. Here is the trade-weighted dollar, valued against a basket of our trading partners’ currencies.

The correlation is not perfect, as the USD peaked in 1985, triggering the Plaza Accord, a concerted campaign by central banks to depreciate the dollar against rival currencies. Nonetheless, the USD has trended lower as interest rates fell.
Here is the monetary base of the dollar, which skyrocketed as the Fed ramped up the base in response to the global financial crisis of 2008-09. If this was a dominant force on the dollar, we would expect to see a corresponding decline in the trade-weighted dollar and a leap in the USD price of gold.

The trade-weighted dollar is about where it was before the three-fold expansion of the monetary base. Gold did skyrocket, roughly doubling from its 2008 price range to about $1,750 per ounce today.

But if the price of gold were correlated to the trade-weighted dollar, we would expect to see a rise in gold as the dollar fell from its 1985 peak. It did not, but it did rise as the USD declined from its 2002 peak. In other words, the correlation of gold to the trade-weighted USD is very inconsistent; the USD has remained in a small range since 2008 while gold doubled.
Gold and the USD have actually risen together in some timeframes.
If we step back, what do we notice about the charts of GDP, employee compensation, corporate profits, government expenditures, and gold? Roughly speaking, all have increased ten-fold or more from 1975. From this point of view, gold has simply “caught up” with earnings, GDP, profits, government spending, etc.
While the dollar’s value against other currencies has declined as bond yields dropped, from the long view its 2009 value places it back in a range going back two decades to the early 1990s.
Though the monetary base roughly doubled from 1990 to 2005, gold in 2005 was still around $400 per ounce, same as its price back in 1990.
In other words, the price of gold is not consistently correlated to the monetary base, the trade-weighted dollar, or interest rates. Gold appears to march to an independent drummer.
A Distinct Lack of Consistent Correlations
Where does this comparison of charts leave us? With a distinct lack of consistent correlations.
It would seem that the commonly touted drivers of the dollar’s value, measured in either trade-weighted USD or in gold, are inconsistent; none of them correlate consistently over time.
The three metrics of interest rates, gold, and the trade-weighted dollar appear to have minimal impact on productivity, profits, output, earnings, or the domestic standard of living, as these three have jumped around with no visible impact on broad measures such as GDP or earnings.
We have seen interest rates leap to 16% and fall to near-zero; gold collapse, stagnate, and then quadruple; and the dollar gain and lose 30% of its trade-weighted value in a few years. None of these huge swings had any correlation to broad measures of domestic activity such as GDP.
Clearly, interest rates occasionally (but not always) affect the value of the trade-weighted dollar, and the monetary base occasionally (but not always) affects the price of gold, but these appear to have little correlation to productivity, earnings, etc., or to each other.
In Part II: Why Gold & the Dollar May Both Rise from Here we explore the key question: Given the low correlation of the dollar’s value to gold or broad measures of the domestic economy, what will its relative rise or decline mean in the domestic and international economies?
Click here to read Part II of this report (free executive summary; paid enrollment required for full access).
My new book Why Things Are Falling Apart and What We Can Do About It is now available in print and Kindle editions--20% to 30% discounts this week only.
New video on Triffin's Paradox and The Rule of Law, CHS with Gordon T. Long.
New video on Triffin's Paradox and The Rule of Law, CHS with Gordon T. Long.
Things are falling apart—that is obvious. But why are they falling apart? The reasons are complex and global. Our economy and society have structural problems that cannot be solved by adding debt to debt. We are becoming poorer, not just from financial over-reach, but from fundamental forces that are not easy to identify or understand. We will cover the five core reasons why things are falling apart:
 1. Debt and financialization
2. Crony capitalism and the elimination of accountability
3. Diminishing returns
4. Centralization
5. Technological, financial and demographic changes in our economyComplex systems weakened by diminishing returns collapse under their own weight and are replaced by systems that are simpler, faster and affordable. If we cling to the old ways, our system will disintegrate. If we want sustainable prosperity rather than collapse, we must embrace a new model that is Decentralized, Adaptive, Transparent and Accountable (DATA).
We are not powerless. Not accepting responsibility and being powerless are two sides of the same coin: once we accept responsibility, we become powerful.
This week only, 20% discount on the Kindle edition: $7.95 (retail $9.95) print edition: $24 on Amazon.com
To receive a 30% discount on the print edition: $16.80 (retail $24), follow the link, open a Createspace account and enter discount code B9G5JDXD. (This is the only way I can offer a discount.)
1. Debt and financialization2. Crony capitalism and the elimination of accountability
3. Diminishing returns
4. Centralization
5. Technological, financial and demographic changes in our economyComplex systems weakened by diminishing returns collapse under their own weight and are replaced by systems that are simpler, faster and affordable. If we cling to the old ways, our system will disintegrate. If we want sustainable prosperity rather than collapse, we must embrace a new model that is Decentralized, Adaptive, Transparent and Accountable (DATA).
We are not powerless. Not accepting responsibility and being powerless are two sides of the same coin: once we accept responsibility, we become powerful.
This week only, 20% discount on the Kindle edition: $7.95 (retail $9.95) print edition: $24 on Amazon.com
To receive a 30% discount on the print edition: $16.80 (retail $24), follow the link, open a Createspace account and enter discount code B9G5JDXD. (This is the only way I can offer a discount.)
| Thank you, Eduardo B. ($5/month), for your most-excellently generous subscription to this site--I am greatly honored by your support and readership. |