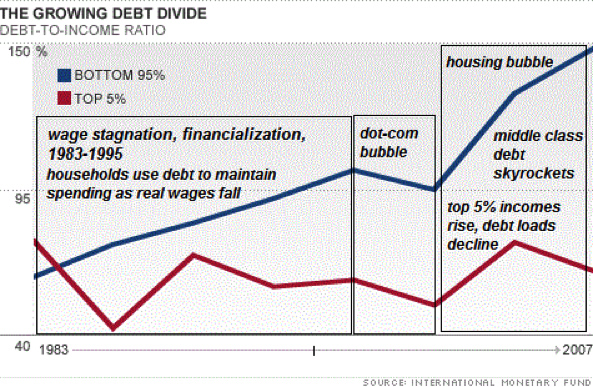
Federal subsidies and Federal Reserve policies enabled a vast expansion of debt that masked the stagnation of income. Now that the housing bubble has burst, this substitution of housing-equity debt for income has ground to a halt.
What could go wrong with the housing recovery in 2013?
To answer this question, we need to understand that housing is the key component in household wealth. As a result, Central Planning policies are aimed at creating a resurgent "wealth effect": When people perceive their wealth as rising, they tend to borrow and spend more freely. This is a major goal of U.S. Central Planning.
Another key goal of Central Planning is to strengthen the balance sheets of banks and households. The broadest way to accomplish this is to boost the value of housing. This then adds collateral to banks holding mortgages and increases the equity of homeowners.
Some analysts have noted that housing construction and renovation has declined to a modest percentage of the gross domestic product (GDP). This perspective understates the importance of the family house as the largest asset for most households and housing’s critical role as collateral in the banking system.
The family home remains the core asset for all but the poorest and wealthiest Americans. Roughly two thirds of all households "own" a home, and primary residences comprised roughly 65% of household assets of the middle 60% of households – those between the bottom 20% and the top 20%, as measured by income. (The U.S. Census Bureau typically divides all households into five quintiles; i.e., 20% each.)
Since housing is the largest component of most households’ net worth, it is also the primary basis of their assessment of rising (or falling) wealth (i.e., the "wealth effect.") No wonder Central Planners are so anxious to reflate housing prices. With real incomes stagnant and stock ownership concentrated in the top 10%, there is no other lever for a broad-based wealth effect other than housing.
Extreme Measures
Given the preponderance of housing in bank assets, household wealth, and the perception of wealth, the key policies of Central Planning largely revolve around housing: keeping interest rates (and thus mortgage rates) low, flooding the banking sector with liquidity to ease lending, guaranteeing low-down-payment mortgages via FHA, and numerous other subsidies of homeownership.
At least three aspects of this broad-based support are historically unprecedented:
1) The purchase of $1.9 trillion of mortgage-backed securities (MBS) by the Federal Reserve.
The Fed purchased $1.1 trillion in mortgages in 2009-10 and it recently launched an open-ended program of buying $40+ billion in mortgages every month. Recent analysis by Ramsey Su found that Fed purchases have substantially exceeded the announced target sums; the Fed is on track to buy another $800 billion within the next year or so. This extraordinary program is, in effect, buying 100% of all newly-issued mortgages and a majority of refinancing mortgages.
Never before has the nation’s central bank directly bought 15%+ of all outstanding mortgages this raises the question: Why has the Fed intervened so aggressively in the mortgage market? There is no other plausible reason other than to take impaired mortgages off the books of insolvent lenders, freeing them to repair their balance sheets.
Regardless of the policy’s goal, the Fed now essentially controls a tremendous percentage of the mortgage market.
2) After the insolvency of the two agencies that backed many of the mortgages originated in the bubble years (Fannie Mae and Freddie Mac), the minor-league backer of mortgages (FHA) suddenly expanded to fill the void left by Fannie and Freddie.
Many of these mortgages require only 3% down in cash, just the sort of risky “no skin in the game” mortgages that melted down in 2008.
Given this mass issuance of low-collateral loans to marginal buyers, it is no surprise that the FHA will soon require a taxpayer bailout to cover its crushing losses from rising defaults.
In 2010,
97% of all mortgages were backed by government agencies, an unprecedented socialization of the mortgage market. (
Source)
This raises two questions: Where would the mortgage and housing markets be if Central Planning hadn’t effectively socialized the entire mortgage market? What will happen to the market when Central Planning support is reduced?
3) Official measures of inflation are viewed by many with a healthy skepticism, but even this likely-understated rate has recently exceeded 2.5% annually.
In this context, it is unprecedented that one-year Treasury bonds have near-zero yields, effectively costing owners a 2%+ annual fee for the privilege of owning short-term Treasuries.
Even more astonishing, rates for conventional 15-year mortgages are comparable to official inflation (the Consumer Price Index, or "CPI"). Lenders are earning near-zero premiums on these mortgages. How sustainable is this imbalance of risk and return?
The enabler of these extremes is, once again, the Federal Reserve, which has purchased hundreds of billions of dollars in Treasury bonds and flooded the banking sector with zero-interest “free money.”
This formidable Central Planning support of housing has placed a bid (i.e., a floor) under housing, resulting in two bounces since the housing bubble popped in 2007-9.
The first heavily subsidized rise faltered. Will the latest pop also reverse? Or is the much-desired “housing bottom” in, from which prices will continue their ascent?
In the macro context, what housing bulls are counting on is the emergence of an “organic,” self-sustaining recovery in housing, based not on Central Planning subsidies but on private demand and non-agency mortgages.
Housing skeptics are looking for signs of what will happen when unprecedented support and intervention in the mortgage and housing markets is reduced or withdrawn.
The Foundation of Housing: Debt and Federal Subsidies
About two-thirds of all homeowners have mortgages. As I noted in
The Rise and Fall of Phantom Housing Collateral, mortgage debt doubled from about $5 trillion in 1997, before the housing bubble, to $10.5 trillion in 2007, at the top of the bubble.
This reliance on debt informs the Central Planning policies of lowering interest rates and guaranteeing mortgages via Federal agencies such as the FHA. The only way debt can increase is if incomes rise or the costs and qualification standards of borrowing decline. Since income for 90% of households has been stagnant for decades, the only way debt can expand is by lowering interest rates and reducing the risk exposure of debt issuers via Federal guarantees.
These policies have been pushed to the maximum. As a result, the policy tool bag to further boost housing is now empty.
Now there is only one direction left for interest rates (up) and for housing subsidies and guarantees (down).
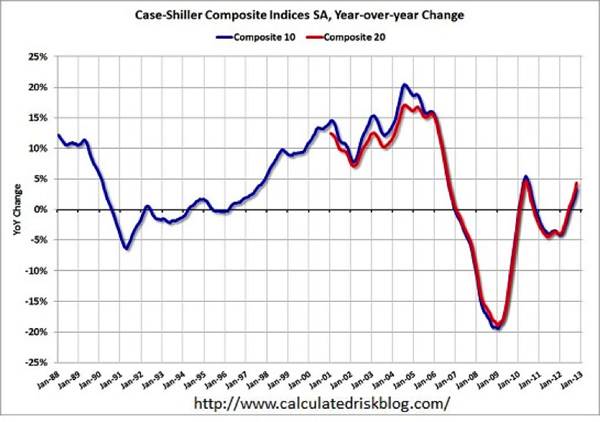
Another support of housing recovery is the restriction of homes on the market. Lenders are limiting the inventory of homes for sale by keeping many distressed/foreclosed homes in the off-market shadow inventory. This artificial restriction, coupled with low rates and government subsidies, has supported the modest recovery shown on this chart (courtesy of Lance Roberts) of total housing activity:
While housing has recovered to 2010 levels, what is not visible is the collapse in housing’s share of net worth displayed in this chart:
Housing equity as a percentage of total net worth declines when the stock market rises strongly while housing gains at a much lower rate (for example, during the Bull markets of 1952-1968 and 1982-2000) and rises as stock equity falls (for example, 1969-1981) while housing rose. In the 2001-2008 era, both equities and housing both climbed sharply, but since housing is the larger share of most households’ net assets, housing’s rise overshadowed the expansion of stock net worth, causing home equity to rise as a percentage of total net worth.
The collapse of the housing bubble and the stock market pushed home equity as a percentage of net worth to new lows. The subsequent doubling in the stock market has had little effect on the bottom 90% of households, as the top 10% of households own 85% to 90% of all stocks. (
Source)
In broad brush, the wealth of middle class of homeowners has been influenced by four trends:
- The stagnation of real income
- A rapid rise in mortgage and other debt
- The use of debt to fund consumption
- The collapse of housing equity as the basis of debt-based consumption
In other words, Federal subsidies and Federal Reserve policies enabled a vast expansion of debt that masked the stagnation of income. Now that the housing bubble has burst, this substitution of housing-equity debt for income has ground to a halt.
This created a reverse wealth effect: The 70% between the bottom 20% and the top 10% have seen their net worth plummet while their debt load remains stubbornly elevated.
Americans saw wealth plummet 40 percent from 2007 to 2010, Federal Reserve says. (Source)
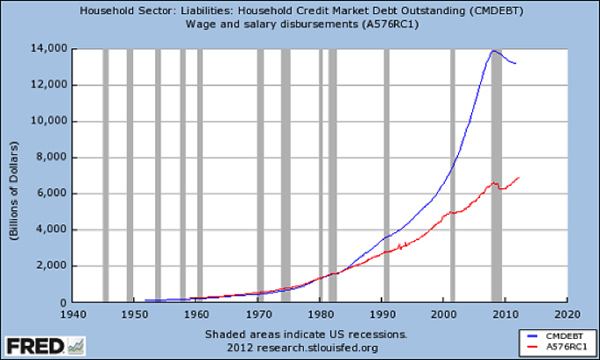
This chart is nominal rather than real (adjusted), but the relative expansion of debt is clearly visible:
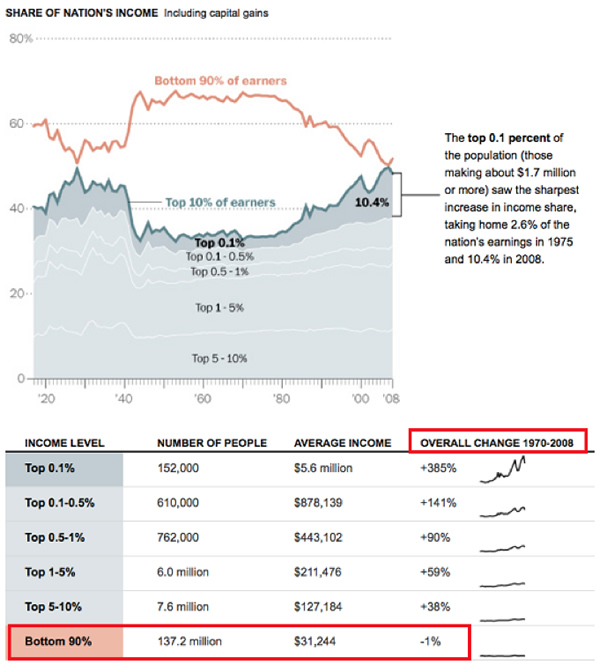
While charts like this lump all household debt and income together, this masks the reality that there is a clear divide between the top 10% and the bottom 90% in terms of income and debt. The debt load of the top 10% is considerably lighter than that of the bottom 90%, while income and wealth gains have flowed almost exclusively to the top 20%.
The top quintile accrued 89% of the total growth in wealth, while the bottom 80 percent accounted for 11%. (
Source)
Unsustainable Pricing Will Introduce the "Poverty Effect"
If we put all this together, we get a picture of a middle class squeezed by historically high debt loads, stagnant incomes, and a net worth largely dependent on housing.
In response, Central Planners have pulled out all the stops to reflate housing as the only available means to spark a broad-based “wealth effect” that would support higher spending and an expansion of household debt.
This returns us to the key question: Are all these Central Planning interventions sustainable, or might they falter in 2013?
Once markets become dependent on intervention and support to price risk and assets, they are intrinsically vulnerable to any reduction in that support.
Should these supports diminish or lose their effectiveness, it will be sink-or-swim for housing. Either organic demand rises without subsidies and lenders originate mortgages without agency guarantees, or the market could resume the fall in valuations Central Planning halted in 2009.
Should housing prices resume a protracted march downwards, as we've detailed here is quite possible, get ready for the "poverty effect" to drain the financial markets of their current euphoria. As the middle 60% of households begin losing a substantial percentage of their net worth, expect consumer spending to dry up and recessionary forces to return in force. (Source: Part II)
Things are falling apart--that is obvious. But why are they falling apart? The reasons are complex and global. Our economy and society have structural problems that cannot be solved by adding debt to debt. We are becoming poorer, not just from financial over-reach, but from fundamental forces that are not easy to identify or understand. We will cover the five core reasons why things are falling apart:
 1. Debt and financialization
2. Crony capitalism and the elimination of accountability
3. Diminishing returns
4. Centralization
5. Technological, financial and demographic changes in our economy
Complex systems weakened by diminishing returns collapse under their own weight and are replaced by systems that are simpler, faster and affordable. If we cling to the old ways, our system will disintegrate. If we want sustainable prosperity rather than collapse, we must embrace a new model that is Decentralized, Adaptive, Transparent and Accountable (DATA).
We are not powerless. Not accepting responsibility and being powerless are two sides of the same coin: once we accept responsibility, we become powerful.
Kindle edition: $9.95 print edition: $24 on Amazon.com
To receive a 20% discount on the print edition: $19.20 (retail $24), follow the link, open a Createspace account and enter discount code SJRGPLAB. (This is the only way I can offer a discount.)
| Thank you, Heriberto V. ($5/month), for your splendidly generous subscription to this site -- I am greatly honored by your support and readership. | | Thank you, Kenji K. ($5/month), for your formidably generous subscription to this site --I am greatly honored by your support and readership. |
Read more...


 1. Debt and financialization


