Long-Term Investing Perspective: Five Charts
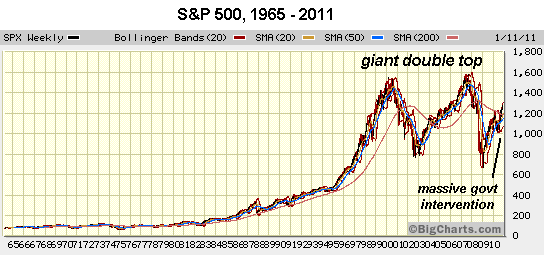
These five charts suggest a long-term investing perspective. Every picture tells a story, and so does every chart. Some readers press on to the next blog as soon as they see a chart here, while others patiently wade through the wordy ravings in hopes that the next entry will bring the refreshing clarity of some charts. I earnestly recommend that even the chart-phobic glance at these five charts.There is a big story told here in these representations of data. As I note below in the HUGE GIANT BIG FAT DISCLAIMER, I do not offer investment advice here, as I am not qualified to do so, nor do I wish to. This blog is the freely offered random ravings of an amateur observer, and nothing more. In the service of transparency, I try to disclose my own positions and will try to disclose recent trades, both good and bad. The idea here is to only reveal positions which have been exited so you will not be tempted to copy my highly risky and anachronistic trading. Here are all my recent trades: 1. QID calls, bought 3/8/11, sold 3/14/11, + 45% 2. SSO calls, bought 3/16/11, sold 3/17/11, +26% 3. GLD calls, bought 3/16/11, sold 3/17/11, +40% 4. SSO calls, bought 3/16/11, sold 3/17/11, +23% Total return for the week: +112.7% It's awfully tempting to "disclose" only winning trades and somehow forget to list the losing trades, but that is really not helpful to readers. These are all my trades of the past week. I have of course made hundreds of losing trades over the years (a very expensive education, heh). Please note the positions taken here were very small, and were highly speculative, i.e. held for a day in most cases or for 5 days at the outside. I will not be retiring on the gains; these trades were made mostly as an intellectual/emotional challenge and to test my trading ideas in the real world. Also note that these are bets (yes, bets, not "investments") on both the long and short side, all within the same week. As I noted earlier in the week, volatile trading is a speculator's ideal scenario, and low-volatility melt-ups are the least profitable environments. I have basically avoided trading for the past few months as I did not see any low-risk opportunities. As insane as it sounds, I considered all these high-risk option trades to be very low-risk bets, and I was acutely aware that I could be dead-wrong and thus was ready to exit the moment the trade was revealed as faulty. My next four trades could all be losers. That's OK, as long as I exit stage left immediately. I currently own some calls on the QID, i.e. a bet that the NASDAQ 100 will decline. If I'm wrong then I will exit that bet and suck the loss. I suspect the market might rally, and perhaps rally big in the coming weeks, but perhaps not just yet. Two last disclosures: I have learned a great deal from readers who are much better traders than I am: for example, Steve R. and Harun I. I am grateful to those readers who have shared their expertise and strategies with me, and my goal here is to attempt to pass on some of the sensibilities I have gained. My Weekly Musings for subscribers and contributors is home to my furthest-out speculations and "notebook" of nascent/gestating ideas. OK, enough disclosure. Let's look at five charts which tell a longer term story. Consumers have taken on a lot of debt and barely begun to pay it down. Their primary store of wealth, their home, has plummeted in value. The number of jobs in the formal economy is declining, a fact masked by the wholesale manipulation of data i.e. removing millions of citizens from the labor pool so the unemployment rate is artifically reduced for propaganda purposes. The Fed has goosed the stock market by destroying the U.S. dollar. The dollar may be reaching a level of support which the Fed cannot break. This is not a win-win strategy--if the Fed succeeds in destroying the dollar, the consequences will be dire for the American people. The Fed and the political "leadership" have blown gigantic asset bubbles as a way of masking the imbalances and rot at the heart of the U.S. economy and machinery of governance. Unprecedented central bank and Central State intervention has blown yet another bubble in stocks, but can the Fed goose the S&P 500 up to a triple top above 1,500? It seems likely that time is running out for the Fed's game plan. Three years of monumental manipulation and intervention has not healed the economy or the market, it has only bought time via "extend and pretend." Since nothing has been actually repaired or addressed, then reality will intrude at some point. Given the ill health of the real economy and its total dependence on Central State borrowing and intervention, I doubt the Fed's QE shuck-and-jive can push the SPX to a triple top. But who knows, maybe they'll manage this one last blow-off top. Longer term, however, it may well be time to exit equities as a "buy and hold" investment for a decade or so. I have been setting up a new PC and a bunch of other tech stuff, so please bear with delayed email responses. Your understanding is greatly appreciated. Of Two Minds is also available via Kindle: Of Two Minds blog-Kindle


If you would like to post a comment, please go to DailyJava.net.
Order Survival+: Structuring Prosperity for Yourself and the Nation (free bits) (Mobi ebook) (Kindle) or Survival+ The Primer (Kindle) or Weblogs & New Media: Marketing in Crisis (free bits) (Kindle) or from your local bookseller.Thank you, Eugenio M. ($15), for your long-standing and much valued contributions to this site-- I am greatly honored by your support and readership. Thank you, Lisa P. ($75), for your outrageously generous contribution to this site -- I am greatly honored by your support and readership.


